Lecture 22: Experime ntal Design
Prof. Esther Duflo
14.310x
1
• What is being randomized?
• The intervention(s)
•
Who is being randomized?
• The level of randomization (schools, individuals, villages, cells)
• The sample over which you randomize (eligible people,
population, people who applied,etc)
•
How is randomization introduced?
• Method of randomization
• Stratification
• How many units are being randomized?
• Power
2
• Introducing randomization when it may not be otherwise
obvious
• Answering specific question(s)
3
• Simplest randomization: define your sample frame and your
unit of randomization, use software to randomly assign one
group to treatment, one to control
• Stratification: create group that are similar ex-ante. You will
compare outcomes within each strata. It will help power by
reducing variance
• Clustering: randomize instead at the group level. It will hurt
power (since people who are similar share the same treatment
status) but may be the only option.
4
• Phase in design
• Randomization “in the bubble’
• Encouragement design
5
• Choose target individuals or communi7es to be
covered over several years
• Randomize the order in which they are phased in
• Those not yet phased in are the comparison
6

Randomized*phase.in*
• Choose*target*individuals*or*communi7es*to*be
covered*over*several*years
• Randomize*the*order*in*which*they*are*phased*in
• Those*not*yet*phased*in*are*the*comparison
Randomized Phase-in diagram removed due to copyright restrictions.
Please see Running Randomized Evaluations: A Practical Guide by Rachel
Glennerster and Kudzai Takavarasha.
7
• Estimating general equilibrium effects
• Unpacking the effect of an intervention to understand it better
10
• High unemployment: a promising labor market policy is job
placement assistance (Card Kluve Weber, 2010)
• Several randomized evaluation exists: usually similar workers
are assigned to a group versus another.
• An important criticism against the existing evaluations of
these programs (and similar such as training program): gains
can be offset by displacement effects (queue-jumping)
11
• We take advantage of a large-scale search assistance program
which was implemented in France in 2007 (targeted half of
administrative regions)
• Two-step RCT: randomly assign the proportion of treated to
areas ; randomly assign treatment status to individuals within
areas
12
•
Youth unemployment an important issue in many countries
(18% in the US, 23% in France or the UK, 36% in Italy, more
than 50% in Spain and Greece)
• In 2007, new job search assistance program for 10,000 young
job seekers
• Private counseling firms contracted with the objective to bring
job seekers back to long-term jobs (idea of stepping stone)
• Target population:
• Less than 30 years old
• Unemployed for more than 6 months (or cumulating more than
12 months over the last 18 months)
• Diploma after 2 years of college
13
•
Payment conditional on objectives:
• 25% if the job seeker enrolled
• 40% if the job seeker signed a stable contract within less than
6 months
• 35% if the former job seeker is still employed six months after
the job has been found
14

Two-step randomization
1 At the local employment agency (LEA) level:
• One LEA in each city of more than 30,000 inhabitants
• Partition 235 LEAs into 47 homogenous quintuplets
• Randomly assign within each quintuplet the assignment
Diagram
proportions 0%, 25%, 50%, 75% and 100%
2 Next, at the individual level: each individual is randomly
assigned to the treatment or control, the assignment rate
depending on the LEA to which he belongs
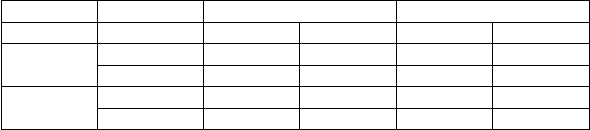
15

not assigned
assigned
75%
0%
100%
50%
25%
16
• Super control group: individuals in 0% assignment areas
• Comparing assigned to control and super control
→ Displacement effect
•
Comparing assigned to treatment and super control
→ Effect on the treated
17

Unemployed
Program Participation
Number of meetings
with a counselor
Control mean
Received help with CV, coaching
for interviews, etc.
Control mean
Help with matching (identify
job offers, help with transportation)
Control mean
0.441***
(0.010)
0.658***
(0.086)
2.934
0.114***
(0.010)
0.260
0.007
(0.008)
0.194
Observations 9890
18

y
ic
= α + βZ
ic
+ d
c
+ X
ic
γ + c
ic
Outcome: fixed-term contract with a length of more than 6 months
Unemployed
All Men
Women
Assigned to program 0.020*
(0.011)
0.051***
(0.019)
0.005
(0.015)
Control mean
Observations
0.213
9890
0.172
3716
0.237
6174
19

Outcome: fixed-term contract with a length of more than 6 months
All
Unemployed
Men
Women
Assigned to program
In a program area
0.028***
(0.010)
-0.009
(0.011)
0.051***
(0.015)
-0.039**
(0.016)
0.016
(0.012)
0.008
(0.015)
Net effect
of program assignment
Control Mean
0.019**
(0.009)
0.213
0.012
(0.013)
0.172
0.024*
(0.013)
0.237
20
• Estimating general equilibrium effects
• Unpacking the effect of an intervention to understand it better
21
• They examine the Raskin program in Indonesia, which
provides eligible households with 15kg per month of heavily
subsidized rice
• Right now information about the program among citizens is
low:
• Only 30% of eligible households know that they are actually
Raskin eligible, and beneficiaries believe the copay is 25%
higher than it actually is
• Eligible only receive 1/3 of intended subsidy
•
Given low levels of information, officials may have an
advantage in bargaining with villagers
• Question: Will program transparency increase the amount of
subsidy eligible households receive? And why?
22
• Randomized trial in 572 villages working with the Indonesian
government
• In 378 randomly chosen villages eligible households received
Raskin identification cards, which informed them they were
eligible and the amount of rice
23

Sample card
Image by Kyle, Jordan;
Sumarto, Sudarno; Banerjee,
Abhijit; Hanna, Rema N.;
Olken, Benjamin. L icense CC
BY-NC-SA
24
•
Suppose the cards “worked”. What else might you want to
know?
• To elucidate mechanisms, within treatment villages varied 4
aspects of the card program
• Public information about eligibility and cards (in addition to
private information)
• What information was printed on the cards (copay price or not)
• Who received the cards (all eligible households or a subset) to
test whether physical card matters
• Whether cards contained clipoff coupons to examine perceived
accountability effects
25

Publi c vs. private information
• Public vs. private information. Designed to test whether
common knowledge facilitates collective action.
• Private information: village head gets list and one copy posted.
• Public information: in addition, many copies of list and posters
about cards posted
Courtesy of Benjamin Olken. Used with permission.
26

Price vs. no-price
• Price vs. no-price: Designed to test precisely whether varying
information on cards matters
• Varied whether cards contained information on co-pay price or
noy
Image by Kyle, Sumarto, Sudarno; Banerjee, Abhijit; Hanna, Rema N.; Olken, Benjami
n.
License CC BY-
NC-SA
27
Who received cards
• In all villages, full list of eligible beneficiaries was distributed
• But, varied
• Whether cards were sent to all eligibles
• Cards only send to bottom 10% of the population (about
poorest 1/3 of beneficiaries)
•
Designed to test role of physical card in bargaining
28

Coupons
• Coupons or no: Designed to test whether implied checking on
the part of the government changed the results
Image by Kyle, Jordan; Sumarto, Sudarno; Banerjee, Abhijit; Hanna, Rema N.; Olken,
Benjamin. License CC BY-NC-SA
29
• Within the 378 card villages, we want to run 4 different
dimensions on 4 dimensions (so 16 possibilities):
• Public vs. private information
• Information on the cards
• Who received cards
• Tear-off coupons or no
30
Public Private
Price No price Price No price
Cards to All Coupons
No Coupons
Cards to Coupons
B10
No Coupons
31
•
Data comes from three follow-up surveys:
• Conducted 2 months, 8 months, and 18 months after cards
distributed
• Oversampled beneficiaries
• Also interviewed the village leader
•
Administrative data on eligibility status
• Baseline consumption data from the previous experiment
32

Impact on card receipt and use
Ta ble 2: Reduced Form Effect of Card Treatment on Receipt and Use
Eligible Households Ineligible Households
Received Used
Correctly
idenfities own
Received Used
Correctly
idenfities own
Card Card
status
Card Card
status
Card
(1)
0.28***
(2)
0.14***
(3)
0.09***
(4)
0.02**
(5)
0.03**
(6)
0.04*
Treatment (0.02) (0.02) (0.02) (0.01) (0.01) (0.02)
Observations
Control Mean
5,693
0.06
5,693
0.06
5,691
0.30
3,619
0.05
3,619
0.05
3,619
0.35
• Note that only 28% of eligibles received card.
33
• Results suggest cards had a substantial impact
• Increase in subsidy for eligibles of 25%
• And this is with only 28 pp increase in cards. With full
penetration of cards, could have been higher
• Cost effective: increase in subsidy is well over 5 times the cost
of the cards over the period of the study.
•
Investigate mechanisms:
• Kinds of information
• Providing public vs. private information
• Providing more information on the cards about the program
• Providing physical cards with the information
•
Testing accountability effects through coupons
34
•
Public information
• Cards provide individual information on one’s eligibility status.
• But, if I am thinking of protesting, I may need to know if
others would join me if I protested: common knowledge matter
• To test this we varied the information about the program:
• Standard information: List sent to village head and one poster
with beneficiary lists posted
• Public information: 3 posters per hamlet and mosque radio
announcements
•
test whether this indeed changed people’s beliefs, and whether
it in turn affected outcomes
35

Knowledge and beliefs
Table 7: Effect of Public Information on Seeing the Eligibility List
Village Informal
Eligible Ineligible
officials Leaders
(1) (2) (3) (4)
Public Info
Panel A: Respondent has s
een
the list
0.14*** 0.10*** 0.20***
0.14**
(0.02) (0.02) (0.06) (0.05)
Standard Info 0.02 0.01 0.03 0.02
(0.01) (0.01) (0.06) (0.05)
Difference:
Public - Standard
0.11*** 0.10*** 0.17*** 0.12**
(0.02) (0.02) (0.06) (0.05)
Observations 5,685 3,619 496 385
Control Mean 0.07 0.06 0.36 0.12
Panel B: Respondent believes that stated category of individuals has seen the
list
Public Info 0.35*** 0.26*** 0.24*** 0.24***
(0.04) (0.03) (0.05) (0.05)
Standard Info 0.07 0.01 0.03 0.06
(0.04) (0.03) (0.05) (0.04)
Difference:
Public - Standard
0.28*** 0.25*** 0.22*** 0.18***
(0.05) (0.04) (0.06) (0.05)
Observations 9,304 9,304 9,304 9,304
Control Mean 0.31 0.15 1.04 0.47
Note: This table provides the reduced form effect of the public information treatments
on seeing the eligibility list. In Panel A, the sample is the stated category in the column
and the outcome is a dummy indicating whether the individual has seen the eligibility
list; “Do not know” answers are coded as zero (not seen) Panel B includes all survey
36

Impacts
Table 9B: Effect of Public Information on Rice Purchases and Price
Eligible Households Ineligible Households
Bought in Amount Price Subsidy Bought in Amount Price Subsidy
the Last 2
Months
Purchased
(Kg)
(Rp.) (Rp.) the Last 2
Months
Purchased
(Kg)
(Rp.) (Rp.)
(1) (2) (3) (4) (5) (6) (7) (8)
Public Info
0.03
1.54***
-
79***
9,081*** -0.07*** 0.09 -50* 657
(0.02) (0.30) (21) (1,665) (0.03) (0.23) (27) (1,256)
Standard Info 0.01 0.79*** -41* 4,778*** -0.04 0.07 -26 527
(0.02) (0.30) (22) (1,690) (0.03) (0.22) (25) (1,222)
Difference:
Public - Standard 0.01 0.75** -38* 4,303** -0.03 0.03 -24 129
(0.02) (0.36) (22) (1,999) (0.03) (0.25) (25) (1,338)
Observations
5,685 5,684 4,873 5,684 3,619 3,619 2,283 3,619
Control Mean
0.79 5.29 2,276 28,605 0.63 3.46 2,251 18,754
Note: This table provides the reduced form effect of public information treatment groups on rice purchases, by eligibility status, as
com
•
pared to the that did not receive a card under the bottom ten treatment are dropped from the
sample and we reweight the treatment groups by sub-district so that the ratio of all three income groups is the same. For each household,
the variables foramount purchased, price and subsidyare averages overthe past fourmonths;the currentmonth is droppedif the
interview occurred before the 25th day of the month.The amountand subsidy are set equal to zero if the household doesnotpurchase any
Raskin rice, whereas the price is calculated among purchasing households. Data are pooled from the first and second follow-up survey.
Each column in this table comes from a separate OLS regression of respective outcome on the two treatments, sub-district fixed effects,
survey sample dummies and dummy variables for the previous experimental design. We also provide the difference in the two card
treatments. Standard errors are clusteredbyvillage.
*** p<0.01, ** p<0.05, * p<0.1
37

Information about prices
Image by Kyle,
Jordan; Sumarto ,
Sudarno;
Banerjee,
Abhijit; Hanna,
Rema N.; Olken,
Benjamin. License
CC
BY-NC-SA
• Changing the information on the cards is the cleanest test of
information
• Everything held constant except we added a single extra line
to the cards with co-pay price information
38

Impacts of price inform ation
Table 11B: Effect of Printing Price on Cards on Rice Purchases and Price
Eligible Households Ineligible Households
Bought in Amount Price Subsidy Bought in Amount Price Subsidy
the Last 2
Months
Purchased
(Kg)
(Rp.) (Rp.)
the Last 2
Months
Purchased
(Kg)
(Rp.) (Rp.)
(1) (2) (3) (4) (5) (6) (7) (8)
Cards with Price 0.01 1.13*** -55** 6,708*** -0.04 0.12 -37 881
(0.02) (0.36) (25) (2,056) (0.03) (0.26) (29) (1,415)
Cards without Price 0.01 0.46 -34 2,935 -0.04 0.08 -7 451
(0.02) (0.32) (24) (1,797) (0.03) (0.25) (27) (1,349)
Difference:
Price - No Price
0.00 0.67* -21 3,773* -0.01 0.03 -31 430
(0.02) (0.36) (25) (2,031) (0.03) (0.24) (25) (1,279)
Observations
5,688 5,687 4,877 5,687 3,615 3,615 2,281 3,615
Control Group Mean
0.79 5.29 2,276 28,605 0.63 3.46 2,251 18,754
Note: This table provides the reduced form effect of belonging to the Price and No Price treatment groups on rice purchases by eligibility
status. Data are pooled from the first and second follow-up survey. Eligible households that did not receive a card under the bottom ten
treatment are dropped from the sample and we reweight the treatment groups by sub-district so that the ratio of all three income groups is the
same. For each household, the variables for amount purchased, price and subsidy are averages over the past four months; the current month is
dropped if the interview occurred before the 25th day of the month. The amount and subsidy are set equal to zero if the household does not
purchase any Raskin rice, whereas the price is calculated among purchasing households. Each column in this table comes from a separate
OLS regression of respective outcome on the two treatments, sub-district fixed effects, survey sample dummies, dummy variables for the
previous experimental design, and a dummy for whether the village was also in the public information treatment. We also provide the
difference in the two card treatments. Standard errors are clustered by village. *** p<0.01, ** p<0.05, * p<0.1
39
•
In all card villages, village heads received a letter with the
complete list of eligible households, and all lists that were
posted publicly had the complete list
• But, the government varied who received the cards
• In half of villages, cards were mailed to all beneficiaries
• In the other half of village, cards were mailed only to the
bottom 10% of all households (about bottom 1/3 of
beneficiaries)
•
We can analyze our data separately for these three groups of
households – eligible bottom 10, eligible non-bottom 10, and
ineligible
• This isolates the role of getting a card per se
40
Who receives cards
Subsidy received by….
Bottom 10 Other eligible Ineligible
households households households
Cards to Bottom 10
Cards to All
(1)
4,662**
(1,911)
4,484**
(2,238)
(2)
1,624
(1,783)
4,779**
(1,869)
(3)
691
(1,338)
690
(1,409)
Bottom 10 - All 178 -3155* 1
(2091) (1833) (1257)
Observations
Control Group Mean
3,682
29457
2,966
27941
3,619
18428
41

