
1
16.1(a)
Board Meeting, October 19, 2022
Directive 9:
Annual Equity Accountability
Report Card
Strategic Alignment:
Directive 9: Annual Equity Accountability Report Card
Report Type:
Information
Prepared by: Paul da Silva, Associate Director: School Improvement and Equity
Submitted by: Rashmi Swarup, Director of Education
2
Overview
Objective:
In accordance with Ministry Directive 9, this report includes the second Annual Equity
Accountability Report Card. The report card provides trend data from 2018-19 to 2021-22 for a
number of outcome indicators. Its purpose is to provide insights into the disproportionate
experiences of Peel District School Board (PDSB) students over the last four school years.
Background:
Following the release of the Ministry of Education Review of the PDSB in March 2020 (Chadha
et al., 2020), the PDSB has been undertaking system transformation to ensure that the well
documented and historical inequities in student achievement and experiences are eliminated.
Racism can be defined as “a series of persistent practices that systematically and unjustly
allocate advantages to certain groups and individuals” (Ryan, 1998, p. 2). In Ontario, our
education system is a colonial structure that was constructed to favour whiteness and white
Eurocentric norms. As a result, systemic discrimination creates unequal and disparate learning
outcomes for students based on their identities.
The PDSB’s mission statement asserts, “We inspire success, confidence and hope in each
student.” In order to do this, we must identify, confront and disrupt the systemic inequities that
persist today for students with particular identities and intersectional identities, most notably
those who identify as Indigenous, and African, Black and Afro-Caribbean.
The Terms of Reference of the Ministry Review required the investigators to review allegations
of systemic racism, particularly anti-Black racism (Chadha et al., 2020, p. 5). The Ministry
Review made recommendations about equity and human rights that impact all communities in
the PDSB with specific recommendations that affect African, Black, and Afro-Caribbean
communities. The authors also pointed out issues that were raised regarding South Asian
students (particularly male Punjabi students), about Islamophobia, anti-Semitism, 2SLGBQA+
students, Indigenous and Latinx/Hispanic students (Chadha et al., 2020, p. 6).
Evidence
Outline of the Report Card
The report card organizes the outcome indicators according to the Peel District School Board’s
four Board Improvement and Equity Planning focus areas:
1. Student Achievement
o Credit Accumulation
o Grade 9 and 10 Literacy and Numeracy
2. Human Rights and Equity
o Student Discipline
3. Mental Health and Well-Being
o Persistent Absences
4. Pathways and Transitions
o Special Education Designations

3
o Academic and University Pathways
o Regional Learning Choice Programs
o French Instruction
Where applicable, each of these outcome indicators are disaggregated by Indigenous and
Racial Identities, Gender Identities, Sexual Orientation (2SLGBQA+), Socioeconomic
Vulnerability Index (SVI), Individual Education Plan (IEP) Status, and English Language Learner
(ELL) Status.
Examining the outcomes in this report disaggregated by religion demonstrated two consistent
groups that experience disproportionate outcomes: students who indicated they were Christian
and those that did not affiliate with a religion. With further investigation it became apparent that
there were intersecting identities that better explained these outcomes. As a result,
disaggregated outcomes by religion are not included in this report.
Summary of Findings:
Below are some of the key finds for each focus area and emerging trends since the first Equity
and Accountability Report Card. Please review the entire report for a more detailed account.
Student Achievement:
• Consistent over-representation of identities that have been traditionally marginalized.
African, Black, and Afro-Caribbean, Indigenous, Latinx/Hispanic, Mixed Race and Middle
Eastern students have not been granted credits at the expected pace to graduate within
four years. This trend is consistent across grade levels and remains the same or
increasing across years of study, suggesting that the barriers are still pervasive, and that
racism is an active factor.
• Socioeconomic Vulnerabilities are a significant barrier to credit accumulation. Across
almost all grades and school years, students who experience very high socioeconomic
vulnerabilities accumulate fewer credits (Robson et al., 2016).
• African, Black, and Afro-Caribbean, Indigenous and Latinx/Hispanic students are most
likely to be assessed below Levels 3 or 4 in Grade 9 and 10 Academic English. These
findings indicate that while de-streaming Grade 9 Mathematics and English courses may
remove some barriers, likely there are prior gaps in access to learning that continue to
disadvantage some students.
• Students who experience very high socioeconomic vulnerabilities are less likely to be
assessed at the Provincial Standard of Level 3 or 4 in Academic English. This
disproportionate outcome has increased during the last three years.
Human Rights and Equity:
• Suspensions are disproportionate for African, Black, and Afro-Caribbean and Indigenous
students despite decrease in overall suspensions. While there is a reduction in the
number of suspensions in 2021-22 compared to 2018-19, African, Black, and Afro-
Caribbean and Indigenous students continue to be more than two-times more likely to be
suspended
• Students with special education needs experience barriers to learning. Students who
have an IEP are more than three times more likely to be suspended. Students identified
with an exceptionality that does not require a medical doctor diagnosis (Behavioural,

4
Language Impairment, Learning Disability, Mild Intellectual Disability), and therefore is
more subjective, are even more likely to receive a suspension.
Mental Health and Well-Being:
• Absenteeism is almost twice as high among some marginalized groups. African, Black,
and Afro-Caribbean, Indigenous, Latinx/Hispanic and Middle Eastern students
experience higher instances of absenteeism compared to other students, suggesting
that schools may not be places where they feel safe and/or offer a sense of belonging.
(Curry-Stevens & Kim-Gervey, 2016).
• Socioeconomic Vulnerabilities are a significant factor in students’ attendance outcomes.
Students with high SVI have been absent at a much higher rate consistently over the
years indicating that students who experience these vulnerabilities may not find learning
environments accessible, safe or conducive to their learning (Van Eck et al., 2017).
• Gender Diverse students are consistently more likely to be absent compared to those
who identify as male or female. While there has been parity for boys and girls over the
last 4 school years, students who identify with a diverse gender experienced much
higher instances of absenteeism, with an important decline in the 2020-21 when schools
were primarily online, suggesting that in-person school environments may not be places
where they feel safe and/or a sense of belonging (Pampati et al., 2020).
Pathways and Transitions:
• Students who identify as Indigenous, African, Black, and Afro-Caribbean, and White are
most likely to be identified with an exceptionality. African, Black, and Afro-Caribbean
students are about four times more likely to be identified with a behavioural
exceptionality and are one and a half to three times more likely to be identified with
language impairment, learning disability and mild intellectual disability. Indigenous
students are about four to five times more likely to be identified with the following
exceptionalities – autism, language impairment and, learning disability; they are also two
times more likely to be identified with a mild intellectual disability exceptionality.
• Students experiencing very low socioeconomic vulnerabilities (SVI) are two and a half
times more likely to be identified as gifted compared to students with higher SVI
suggesting that gifted assessments privilege those with access to more resources
(Parekh, et al., 2018).
• With the discontinuation of Applied programming in Grade 9, a higher proportion of
students are accessing Academic (de-streamed) programs which can lead to university
level courses. However, reviewing the outcomes, we see that African, Black, and Afro-
Caribbean students, Indigenous, Latinx/Hispanic, those with a very high SVI and those
with an IEP are still disproportionately streamed out of these opportunities.
• Some marginalized groups are underrepresented in university pathways in grade 12.
African, Black, and Afro-Caribbean students, along with Indigenous and Latinx/Hispanic
students, those experiencing very high and high socioeconomic vulnerabilities, and
students with Diverse Gender Identities, are disproportionately underrepresented in
university track pathways compared to others.
• African, Black, and Afro-Caribbean, Indigenous, Latinx/Hispanic, Middle Eastern, and
Southeast Asian students are underrepresented in Regional Learning Choice Programs
(RLCP). African, Black, and Afro-Caribbean students are severely underrepresented in
AP, IB, Business, Science and Technology programs. However, African, Black, and

5
Afro-Caribbean students are overrepresented in sports programs which may stem from
the harmful stereotype that associate Black children and youth with physical prowess
and superior athletic abilities further eroding their access to academic success (James &
Turner, 2017). Indigenous students are also severely underrepresented in all programs
with the exception of the Arts and AP programs.
Emerging Trends
• Online learning may have had varying impact on learners of different racial backgrounds.
African, Black, and Afro-Caribbean students across most grade levels consistently show
less credit accumulation in more recent years, suggesting they may have experienced
more impact by the disrupted schooling during COVID-19 closures. Similar patterns are
observed for students who identified with an additional racial background or as having
multiple racial backgrounds.
• COVID-19 impact is more severe on students experiencing socioeconomic
vulnerabilities. Credit accumulation gaps for students who experience very high
socioeconomic vulnerabilities have increased over the last three years, particularly for
students in Grade 10. This suggests that COVID-19 may have further exacerbated the
barriers experienced by these students.
• COVID-19 may have affected some students’ academic achievements more than others:
Students who identify as African, Black, and Afro-Caribbean are less likely to be
assessed at Level 3 and 4 in grade 9 and 10 Academic English in comparison to their
pre-COVID-19 learning (2018-19), suggesting that the barriers they are experiencing
have remained and worsened.
• Students with an IEP are more likely to be persistently absent than students without an
IEP. Though absenteeism has continued to remain much higher among students with
an IEP than students without an IEP, the pandemic may have negatively contributed to
their experiences as they have consistently experienced higher instances of
absenteeism, compared to pre-COVID-19, when learning was in-person. In the 2021-22
school year, they continued to be absent much more frequently, suggesting that the
limited availability of support for students with an IEP during remote learning (Rolland,
2020) may have also been a barrier for Peel students, for whom virtual classes were
spaces not conducive to their learning needs.
• Despite, the boards’ self-identification process for regional learning choice programs that
began in the 2020-2021 school year to address disproportionalities, there continues to
be disproportionate involvement for African, Black, and Afro-Caribbean and Indigenous
students. Unfortunately, the change in admissions process will likely take several years
to be reflected in the data as the nature of RLCPs having one-time entry will mean that
past inequities in admissions will persist in enrolment numbers. However, there is a
slight increase in African, Black, and Afro-Caribbean students participating in the Arts
programs.

6
Impact Analysis
Equity & Human Rights Review:
This report affirms the need for continued system change and transformation to ensure that
African, Black, and Afro-Caribbean, Indigenous, and other students who have been
marginalized and underserved because of systemic inequities have access to the high-quality
education and experiences they are entitled to under Human Rights and the Education Act (e.g.,
Culturally Responsive and Relevant pedagogy and resources; Universal Design for Learning
that for instance promotes student voice, agency, ownership and equitable assessment).
Board or Ministry Policy Alignment:
This report identifies that African, Black, and Afro-Caribbean, Indigenous and other racialized
students, students who identify with a diverse gender, 2SLGBQA+ students, students who
receive special education or additional English language supports continue to face systemic
inequities in achievement as summarized in the Ministry Review of the Peel District School
Board. The data presented is aligned with the requirements of Ministry Directive 9 to: i) report
on clearly defined student-centered outcomes including eliminating disparities in achievement of
students from the Board’s various communities (Chadha et el., 2020).
Resource Implications:
The trends presented of African, Black, and Afro-Caribbean, Indigenous and other racialized
students, students who identify with a diverse gender, 2SLGBQA+ students, students who
receive special education or additional English language supports require continued attention.
Continued inquiry into the intersecting relationships between achievement and schooling
experiences, race, and gender is necessary to inform future efforts towards system
transformation and sustainability of the necessary changes.
Legal implications:
The Peel District School Board has a duty to uphold each student’s human rights and create an
education system free from discrimination. The legal framework for the report card is in
accordance with the Ontario Education Act and the Ontario Human Rights Code.
Risk Assessment:
The Peel District School Board has been provided a strong mandate through the Ministry
Review to address disproportionate outcomes for African, Black, and Afro-Caribbean,
Indigenous and other students who have been historically marginalized. As stated in the
Ministry Review, “The task for those leaders is to bend best efforts of our education systems
into effective service for all” (p.36). As an organization, we must remain steadfastly focused on
ensuring that all PDSB students can realize their full potential in classrooms and schools where
they are supported, respected, valued, and welcomed (Chadha et al., 2020, p. 2). The students
and families in Peel have a right to a high-quality education. As a Board we have a moral and
ethical obligation to address and eliminate disproportionate outcomes for African, Black and
Afro-Caribbean, Indigenous and other students who have been historically marginalized.

7
Next Steps
Action Required:
• The content of this annual Equity Accountability Report Card (EARC) will be used by all
stakeholders to monitor change over time as well as identify areas for improvement. The
Research and Accountability team will work directly with each department and steering
committee to support the interpretation and use of this report. Specifically, it will be used
to inform:
o the monitoring of the Board Improvement and Equity Plan (Fall 2022),
o the development of future Board Improvement and Equity Plan foci (2022-23),
o goal setting and action planning for individual School Improvement and Equity
Plans (Fall 2022),
o the development of department goals and strategic actions (Fall 2022),
o the development of professional learning based on areas requiring additional
supports (2022-23)
o the development of the anti-Islamophobia Strategy (2022-23 school year), and
o the monitoring of the Black Student Success Strategy (Fall 2022).
• To ensure the ongoing development and reporting of disaggregated outcomes in the
Annual Equity Accountability Report Card, the following will be completed:
o the Peel DSB Identity-Data Collection Policy (Winter 2023), and
o a new student census will be conducted in Spring of 2023.
• Additionally, this report will be used to support ongoing work throughout the 2022-23
school year. For example, it will be used to:
o promote a culture of transparency and accountability for actions taken at system,
school, and classroom levels,
o inform policy review and development, and
o guide educators and leaders to interrogate biases and structures rooted in white
supremacy and promote action for anti-oppressive practices including strategies
to work with community.
• The next annual Equity Accountability Report Card will be produced in the Fall of 2023.
Success Measures:
Success Criteria:
• Completion of the Identity-Based Data Collection Policy,
• Completion of the next Student Census in Spring 2023,
• Evidence of a wide range of stakeholders (e.g., system leaders, school leaders,
community members) using the report to inform PDSB’s next steps,
• Evidence of the EARC providing value and usability for stakeholders,
• Collecting and using feedback to improve the report over time.

8
Measurement tools:
• Tracking the number of department and steering committee meetings the Research &
Accountability Team attend to support groups in the use of the EARC
• Tracking the number of times this report is accessed through the www.peelschools.org
and intranet sites.
• Feedback gathered from stakeholders on the value, usability, and suggested changes or
additions of the Equity Accountability Report Card.
• The development and implementation of a professional learning strategy based on this
report.

9
References:
Chadha, E., Herbert, S., & Richard, S. (2020). Review of the Peel District School Board. Ontario
Ministry of Education. Retrieved from http://www.edu.gov.on.ca/eng/new/review-peel-
district-school-board-report-en.pdf
Curry-Stevens, A., Kim-Gervey, C., & Chief Education Office Research Team. (2016). Chronic
absenteeism report.
James, C. E., & Turner, T. (2017). Towards race equity in education: The schooling of Black
students in the Greater Toronto Area. Toronto, ON: York University. Retrieved from
https://edu.yorku.ca/files/2017/04/Towards-Race-Equityin-Education-April-2017.pdf
Pampati, S., Andrzejewski, J., Sheremenko, G., Johns, M., Lesesne, C. A., & Rasberry, C. N.
(2020). School climate among transgender high school students: An exploration of
school connectedness, perceived safety, bullying, and absenteeism. The Journal of
School Nursing, 36(4), 293-303.
Parekh, G., Brown, R. S., & Robson, K. (2018). The social construction of giftedness: The
intersectional relationship between whiteness, economic privilege, and the identification
of gifted. Canadian Journal of Disability Studies, 7(2), 1-32.
Robson, K., Anisef, P., & Brown, R. (2016). “Identifying the complexity of barriers faced by
marginalized youth in transition to postsecondary education in Ontario”, in Wolfgang
Lehmann (Ed), Education and Society: Canadian Perspectives. London: Oxford
University Press, 2016.
Rolland, K.M. (2020). COVID-19, “learn at home,” & students with disabilities in Ontario.
International Human Rights Internship Program, Working Paper Series, 9(1), 1-40
Ryan, J. (1998). Understanding racial/ethnic stereotyping in schools: from image to discourse.
Alberta Journal of Educational Research, 44(3), 284-301.
Van Eck, K., Johnson, S. R., Bettencourt, A., & Johnson, S. L. (2017). How school climate
relates to chronic absence: A multi–level latent profile analysis. Journal of School
Psychology, 61, 89-102.

10
Appendices
EARC Report – Fall 2022
1
Annual Equity Accountability Report Card:
Looking at trends over time from 2018-19 to 2021-22 of Equity Gaps in Student Outcomes
October 2022
Research & Accountability
putting research into practice
2
1.0 Introduction
Following the release of the Ministry of Education Review of the Peel District School Board (PDSB) (Chadha et al., 2020)
in March 2020, the PDSB has been undertaking system transformation to ensure that the well documented and
historical inequities in student achievement and experiences are interrupted and eliminated. The PDSB recognizes that
in order to achieve our stated mission, which is to inspire success, confidence, and hope in every student, we must
identify and address the systemic inequities that persist today for students with particular identities and intersectional
identities, most notably students who identify as African, Black, and Afro-Caribbean, and/or Indigenous.
1.1 History of the Ministry Review
The Ministry Review of the PDSB was announced on November 7, 2019, by Ontario Minister of Education Stephen Lecce
and was conducted by three independent reviewers: Ena Chadha, Suzanne Herbert, and Shawn Richard, under the
leadership of Patrick Case. The mandate of the reviewers, under the authority of the Education Act, was to provide
observations and recommendations to the Minister of Education and the Peel District School Board related to the
performance of the Board, including, but not limited to issues of systemic discrimination, specifically anti-Black racism,
human resources practices, leadership, and board governance. These specific issues were investigated as a result of
serious concerns that had been raised repeatedly by parents and members of the African, Black, and Afro-Caribbean
communities. After consultations with students, staff, families, trustees, and community members, the Ministry of
Education released its final review report in March 2020 (Chadha et al., 2020).
The report addressed each of the
identified areas and contained a series of 27 binding directives with over 54 associated actions.
1.2 Ministry Directives and Action Items
The directives (Ministry of Education Ontario, 2020) outlined in the Ministry Review build on the longstanding work of
African, Black, and Afro-Caribbean parents, families, and communities in creating a truly excellent and equitable public
education system. The PDSB is committed to fulfilling these directives through anti-oppression and anti-racism
approaches. Disproportionalities in student engagement, experiences, and outcomes are recognized to be a result of
system policies, programs, and practices that stem from the “historic and systemic nature of anti-Black racism
embedded in Canadian society and institutions – including Ontario’s education system” (James & Turner, 2017, p. 39).
One of the key themes evident in the directives is the importance of monitoring, transparency, and accountability.
Directive 9 specifically instructs the Board to develop and implement a comprehensive Annual Equity Accountability
Report Card. The Annual Equity Accountability Report Card is intended to inform the Board’s efforts to create deep
structural and cultural changes that infuse the core values of equity, inclusion, and human rights into everyday practices,
programs, and policies. The report card is intended to assess and measure the implementation of the directives that
specifically address student outcomes. The One-Year Peel Board Community Update (PDSB, 2021)
provides further
progress information on the full set of directives.
1.3 Conceptual Framework
The data presented in this report is interpreted through the lens of Critical Race Theory (CRT). By centralizing the lived
experiences and realities of racialized individuals and communities, CRT has become an important tool to speak to the
pervasiveness of racism within education and educational institutions (James, 2012),
and against the monolithic ways in
which Indigenous, African, Black, Afro-Caribbean and racialized people(s) are often depicted, imagined, and stereotyped
(Ladson-Billings, 1998).
CRT generates narratives that counter hegemonic, problematic, and often racist ideologies
(James, 2009).
CRT challenges traditional dominant narratives around race, racism and the experiences of racialized people and
communities (Solórzano, D. G., & Yosso, 2002) and enables new and different questions to be asked about race and
racism in public education (Howard, 2008).
The practice of counter-storytelling is commonly utilized, in which stories
about discrimination from the perspectives of racialized individuals are presented to challenge the dominant narratives
of white supremacy that are sustained by deficit views of historically marginalized groups (James, 2012).
These
3
counternarratives recognize the agency that racialized individuals exercise to resist oppressive practices and offer
transformative solutions to eliminate racial inequities (James, 2012).
1.4 Anti-Black Racism and Education
According to the Ministry Review, “anti-Black racism [in Canada] must be placed in its historical context of slavery and
discrimination, including segregation, against Canada’s Black communities” (Chadha et al., 2020, p. 7).
The experiences
of African, Black, and Afro-Caribbean students in Peel are known to be heavily influenced by factors such as racial
separation, low academic expectations, stereotyping and stigma, and racial profiling (Gray et al., 2016).
African, Black,
and Afro-Caribbean youth in Peel schools have repeatedly reported dealing with low expectations of teachers and
administrators, assumptions based on racist stereotypes around their intellectual abilities and commitments to their
education, feelings of exclusion and marginalization from schools, and harsher discipline when compared to white
students (James, 2019a; James & Turner, 2015).
African, Black, and Afro-Caribbean students who attain high grades despite many difficulties are often met with surprise
and disbelief from non-Black students and teachers about their academic achievement. It is through the support of
family members, friends, some teachers, and extracurricular activities that these students are able to emotionally
navigate school (Gray et al., 2016).
Dealing with racism can lead African, Black, and Afro-Caribbean youth to suffer
through depression and issues related to low-self-esteem (James & Turner, 2015).
As it stands, the students entering our
classrooms are consistently navigating and making sense of racism, leading some students to become numb due to the
lack of support, or teachers not believing them when they report racist incidents (James, 2019b).
1.5 Anti-Indigenous Racism and Educational Outcomes
For Indigenous peoples of Canada, the education system has been one that actively enabled and engaged in systemic
discrimination against them since the early 1600s. Beginning with the establishment of the first school for Indigenous
youth in 1620, until the 1900s, the school system “tethered to the erasure of Indigenous culture, language and genocide
of communities” by forcing religious conversions and standardizing the removal of children from their families (Sekaly &
Bazzi, 2021, p. 4).
Between mid-1800s to 1970s, over 150,000 Indigenous children were forcibly separated from their families as part of
Canada’s assimilation policy. This deprived Indigenous children of not only their language and identity, but also
subjected them to poor living conditions and systemic abuse that continue to have negative effects on their mental,
physical, and social well-being (Han, 2021).
In Ontario, it has been noted that despite the government’s efforts to recognize past wrongs and to support Indigenous
learners, policies continue to promote a hidden curriculum that is rooted in colonialism, racism, and cultural/linguistic
imperialism (Currie-Patterson and Watson, 2017).
This approach enables the ongoing exclusion of Indigenous
knowledges from mainstream education, and thus deprives both students and teachers of opportunities to address the
ways in which education continues to colonize and hurt them. Moreover, the negative effects of past experiences are
evident in the ongoing disparities in achievement for Indigenous students. Some of the academic barriers Indigenous
communities experience include lack of educational funding that is in line with Indigenous communities’ needs and
identities (Sekaly & Bazzi, 2021),
the curriculum which remains outdated and biased (Han, 2021), and contrary efforts in
government-led initiatives. This includes the Ontario First Nation, Métis and Inuit Education Policy Framework, which
advocates for the inclusion of Indigenous culture in the curriculum but makes it difficult to do so due to the focus on
large scale provincial testing, a measurement tool that reflects Eurocentric values, and thus further marginalizes
Indigenous students (Currie-Patterson & Watson, 2017).
1.6 Intersections of Race, Education, and COVID-19
The COVID-19 pandemic has had a disproportionate health impact on Black and other racialized families across North
America. Large concentrated urban areas, particularly neighbourhoods that report having the most ethno-culturally
diverse individuals and families in Ontario, have experienced rates of COVID-19 that are disproportionately higher than

4
neighborhoods that are less diverse (Ontario Agency for Health Protection and Promotion, 2020). Racial categories that
are overrepresented in COVID-19 cases when compared to other racial categories within the Peel population are South
Asian, African, Black & Afro-Caribbean and Latinx/Hispanic (Region of Peel, 2020, August). In addition to its health
impacts, COVID-19 has served to exacerbate pre-existing educational inequities of Black and other marginalized
students, particularly in terms of nutrition, academic supports, mental health, and online learning (James, 2020).
2.0 How to Use this Report
The Peel District School Board is committed to improving student achievement and well-being by working to ensure
equitable, accessible, and inclusive learning environments. The Board recognizes that some students face systemic
barriers through policies, programs and practices that create or maintain disadvantages for these students. Ensuring
equitable, accessible, and inclusive learning environments, therefore, requires the intentional identification and removal
of systemic barriers to student success and well-being.
2.1 Engaging with these Data
This report outlines findings that point to disproportionalities in student experiences and outcomes based on socio-
demographic characteristics such as race, gender identity, sexual orientation, socioeconomic vulnerabilities, English
Language Learner (ELL) status, and Special Education Needs.
The PDSB recognizes that the disproportionalities across demographics are the result
of inequities within and beyond schools and school boards
and are not a reflection of deficits within students and families
As such, it is important to review findings in this report with the understanding that:
• biases must be examined to ensure that students, families and communities are not further marginalized or
stigmatized in reviewing and interpreting data;
• disparities in student experiences and outcomes reflect systemic inequities; and,
• responses to disparities in student outcomes must focus on strategies and initiatives to promote equitable
institutional structures and practices.
The following questions are intended to support readers in using an anti-oppression framework to review the findings
in this report:
• What do you notice about the data?
• What stands out for you?
• How does your social location influence how you interpret the data?
• How will you shift or maintain your focus on looking at systems and structures (e.g., school practices, school
environment, Board practices) rather than attributing students’ experiences and outcomes to deficits within
students and families?
• What does the data suggest about the experiences of students and their families?
• What assumptions or inferences might you be making about students and their families based on the data?
• Whose voices may not be represented in the data?
• In what ways are the data similar to, or different from, other data sources (e.g., municipal, community
agencies, other school boards)?
• What additional data sources are needed to understand both complementary and divergent perspectives
regarding educational experiences?
5
2.2 Outcome Indicators
Credit Accumulation – Not on Track is represented by students who did not successfully complete 8 credits by the end
of Grade 9, 16 credits by end of Grade 10, 23 credits by end of Grade 11 and 30 credits by end of Grade 12.
English and Mathematics Academic/De-Streamed Report Card Outcomes. Is represented by students who did not
achieve Level 3 or 4 (provincial standard) in Grade 9 and 10 Academic English and Mathematics.
Regional Learning Choices Programs (RLCP) includes elementary and secondary students who were enrolled in a
Regional Learning Choices Programs. For information about which programs are included, please see the
corresponding elementary and secondary RLCP home pages found on our website, www.peelschools.org.
French Immersion/Extended French includes students enrolled in French Immersion and Extended French for
elementary and secondary students.
Pathways students take through school are complex and varied. This report reviews access to programs such as special
education services, Regional Learning Choice Programs and French Immersion. It also looks at the secondary course
pathways students take that impacts students’ access to post-secondary opportunities.
Students with Special Education Needs as an outcome indicator is reported on by each of the Ministry categories
(autism, behavioural, gifted, language impairment, learning disabilities, mild intellectual disability). Blind and Low
Vision, Deaf and Hard of Hearing, Developmental Disability, Physical, and Speech Impairment are not reported on
individually due to small numbers. Additionally, students who have an IEP without an IPRC, and Students receiving
Placement Services without an IEP or an IPRC is included as categories in this indicator
Suspensions represent elementary and secondary students who received at least one suspension.
Attendance – Persistent Absenteeism represents students who were absent for 15 or more instructional days in
the given school year.
Recent accounting of student perceptions of schooling are not available at this time. A climate/census survey is
planned for spring to gather data about students’ experiences in schools. Some of the topics to be covered are safe and
caring schools (including bullying, harassment, and discrimination), students’ well-being (e.g., sense of belonging),
inclusive experiences at school and students’ relationships with staff and peers.
2.3 Identity Factors
Data were coded by the following identity factors: racial background, gender identity, Socioeconomic Vulnerability Index
(SVI), Students with Special Education Needs, sexual orientation (grades 7-12), and English Language Learner (ELL)
status.
Indigenous and Racial Identity responses were coded into the following categories: African, Black, and Afro-Caribbean;
East Asian; First Nations, Métis, and Inuit; Latinx/Hispanic; Middle Eastern; South Asian; Southeast Asian; White;
Additional Racial Background (single responses only) and Did not Disclose (includes those that left the question blank,
and those that selected “prefer not to answer” and “do not know”). Multiple responses to this question were coded as
Multiple Racial Backgrounds. Note that the use of these specific categories is mandated by the Ontario Anti-Racism Data
Standards (Government of Ontario, 2019).
Gender Identity responses were coded into the following categories: Female, Male, Diverse Gender Identities (includes
Intersex, Questioning, Transgender, Multiple Gender Identities, Nonbinary, Gender fluid, Gender Nonconforming and
Additional Identities that were missed in the student census and Did Not Disclose (includes those who left the question
blank and those who selected “Prefer not to Answer” and “I am not sure what this question is asking”). Gender has
historically been a variable of considerable interest in educational research, and its relationship to academic
6
achievement, especially Math and Science, has been studied for decades (Meinck & Brese, 2019; Voyer & Voyer, 2014)
.
However, only relatively recently have scholars stopped treating gender identity as a dichotomous variable and started
to include gender diverse and gender nonconforming categories into the studies of academic achievement and student
well-being (Glavinic, 2010; Klemmer et al., 2019; Poteat et al., 2014; Selkie, 2018).
Sexual Orientation (Grades 7-12) responses were coded into the following categories: Heterosexual/straight,
2SLGBQA+ (includes Asexual, Bisexual, Gay, Lesbian, Pansexual, Queer, Questioning, Two spirit, multiple sexual
orientations and other sexual orientation) and Did not Disclose (includes those who left the question blank and those
who selected “prefer not to answer,” “do not know” and “I am not sure what this question is asking”). The acronym
2SLGBQA+ does not include T for Transgender nor I for Intersex as these identities are included in Gender Identity. This
variable is included in the report given well documented research indicating that 2SLGBQA+ students are more likely to
face inequalities, experience discrimination, victimization, and bullying, report a lower sense of well-being and
experience a higher prevalence of mental health issues when compared to their heterosexual peers (Poteat et al., 2014;
Friedman & Leaper, 2010; Williams, 2017; Woodford & Kulick, 2014).
This may in turn impact their overall well-being and
academic achievement (Kosciw et al., 2013).
Socioeconomic Vulnerability Index (SVI)
is a measure that provides the socioeconomic context of PDSB students
(Napierala et al. 2019). The variables used to calculate the index include median household income, percent living in
poverty (below $40,000), percent homeowners, percent without a high school diploma and percent with a university
degree within the households of a postal code. SVI scores are grouped into 6 clusters: Very High SVI, High SVI, Somewhat
High SVI, Moderate SVI, Somewhat Low SVI and Low SVI. Very High SVI represents high vulnerability and therefore lower
socioeconomic status while Low SVI represents lower vulnerability and correlates with a higher socioeconomic status.
International educational research established that socioeconomic status is a strong predictor of academic achievement
as it contributes to students’ economic, cultural and social capital (Broer et al. 2019; Buchmann, 2002; Lee et al. 2019;
Perry & McConney, 2013).
Both family and school socioeconomic status have been associated with long-term students’
academic outcomes because children begin school on unequal terms and differences accumulate as they get older
(Broer et al, 2019; Lareau, 2011; Lee & Burkam, 2002).
Students with Special Education Needs may be categorized according to the following exceptionalities as specified in
the Education Act: behavioural, communicational, intellectual, physical and multiple. According to the Ministry of
Education, these categories of exceptionalities “are designed to address the wide range of conditions that may affect a
student’s ability to learn and are meant to be inclusive of all medical conditions, whether diagnosed or not, that can lead
to particular types of learning difficulties” (Ontario Ministry of Education, 2017, p.A14). Students may have one
exceptionality or multiple exceptionalities. In this report card, “main exceptionality” refers to the first or only
exceptionality as listed within the Individual Education Plan.
When reporting Outcome Indicators by Students with Special Education Needs, students with an Individual Education
Plan (IEP) include both students with a formal identification through an Identification, Placement and Review Committee
(IPRC) and students without. Students with one identification of Gifted are excluded from this group.
English Language Learners (ELLs) are categorized as students “whose first language is a language other than English or is
a variety of English that is significantly different from the variety used for instruction in Ontario’s schools” (Ontario
Ministry of Education, 2007, p. 8). They may be enrolled in English Second Language (ESL) or English Literacy
Development (ELD) programs to help them attain the level of proficiency needed for completing schools in Ontario. ELL
students may be African, Black, and Afro-Caribbean, Indigenous, or racialized students. They may also include those
who have recently arrived from countries experiencing instability and crises or may be Canadian-born and come from
areas in Peel with high socioeconomic vulnerabilities.

7
2.4 How to Read the Graphs
This graph shows that students with a very high SVI in 2021-22 were more than two times likely than their
representation in the population to not accumulate 8 credits by the end of Grade 9.
2.5 Disproportionality Index
The Ontario Anti-Racism Data Standards defines a racial Disproportionality Index as “a measure of a racial group’s
overrepresentation or underrepresentation in a program, service, or function relative to the group’s representation in
the reference population” (Government of Ontario, 2019).
This report uses the Disproportionality Index to identify groups that are suspended disproportionately. These indicators
are calculated as follows:
Disproportionality Index =
% ℎ
% ℎ ℎ ℎ
2.6 Data Considerations
Trends over Time. Four years of outcomes are reported throughout this report: 2018-19, 2019-20, 2020-21, and
2021-22. In the spring of 2020, schools began to experience closures due to the COVID-19 pandemic. For the
2020-21 school year, much of the learning was conducted online, significantly impacting tracked data including
attendance measures and reducing in-person disciplinary events.
Access to Identity Data. The 2018 Student Census Data are used in this report to calculate the disproportionality
of experiences by social identity. Only students who participated in the 2018 survey are included in the analyses
disaggregated by these identities. There are no sexual orientation data available for students in Grade 9 in the
2021-22 school year as they were in Grade 6 at the time of survey administration and only Grade 7-12 students
were asked about sexual orientation. As each year passes since the Census was administered, the available
identity data about students decreases. For the 2021-22 school year, social identity data was available for 53%
of all PDSB students (43% of elementary and 76% of secondary students).
Students working towards an Ontario Secondary School Diploma (OSSD). Outcomes related to student
achievement and pathways (e.g., credit accumulation, achievement in English and Mathematics) only include
students who are working towards an OSSD.
Limitation of Disproportionality Index. When the category group size (e.g., students with a behavioural
identification) is small in comparison with the PDSB population, the Disproportionality Index size may become
unexpectedly large. To support interpretation in these cases, the y-axis has been limited to 6.0. The value
calculated is still represented in the graph but, visually, the bar has been limited to indicate disproportionate
experiences without limiting the interpretation of outcomes for other groups represented in the same graph.
8
Did not Disclose. Students who did not disclose their identity on the 2018 Census survey by leaving the question
blank or selecting responses of “I prefer not to answer”, “I don’t know” or “I am not sure what this question is
asking” were recoded into the variable “Did not disclose.” Outcomes across all measures for this group indicate
disproportionate school experiences which suggests that they likely identify with marginalized groups.
Suppression Rate. Groups of students smaller than 10 are not reported and are labeled N/R in an effort to
maintain student confidentiality and validity of the represented data. The value 10 is chosen as a balance
between transparent reporting and minimizing the use of outcomes that could be random rather than a
meaningful pattern.
Reporting Outcomes by Religion. Examining the outcomes in this report disaggregated by religion demonstrated
two consistent groups that experience disproportionate outcomes: students who indicated they were Christian
and those that did not affiliate with a religion. With further investigation it became apparent that there were
intersecting identities that better explained these outcomes. As a result, disaggregated outcomes by religion are
not included in this report.
2.7 Organization of Findings
The Board Improvement and Equity Plan, defined by the Ministry of Education, consists of four focus areas. Based on
outcomes identified in the first Annual Equity Accountability Report Card (PDSB, 2021), these focus areas have been
further refined as areas of work for the PDSB, particularly for students who identify as African, Black, and Afro-
Caribbean, Indigenous and students with Special Education Needs.
Student Achievement: Improved Literacy and Numeracy, and Credit Accumulation
Human Rights and Equity: Fair and just application of Exclusions, Suspensions and Expulsions
Mental Health and Well-Being: Increased Sense of Belonging
Pathways and Transitions: Increased access to pathway opportunities
3.0 Student Achievement
3.1 Credit Accumulation
3.1.1 Summary of Outcomes
Needs:
Consistent over-representation of identities that have been traditionally marginalized. African, Black, and
Afro-Caribbean, Indigenous, Latinx/Hispanic, Mixed Race and Middle Eastern students have not been granted
credits at the expected pace to graduate within four years. This trend is consistent across grade levels and
remains the same or increasing across years of study, suggesting that the barriers are still pervasive, and that
racism is an active factor (see Figure 1-4).
Diverse Gender identities continue to face greater barriers than girls or boys. Students who identified
themselves with a diverse gender identity and those who did not specify a gender continue to accumulate fewer
credits across all grades and years compared to those who only selected Male or Female suggesting that there
are ongoing systemic barriers towards their inclusion. This is not surprising as students who identify as a gender
other than male or female often face discrimination in larger society as well as within the education system
(Glavinic, 2010; Poteat et al., 2014) (see Figure 5-8).
Patriarchal Influences. There are significant gender differences as girls consistently outperform boys and those
with diverse gender identities when it comes to credit accumulation, affirming larger social trends; while boys
tend to accumulate less credits than girls, there are nonetheless potential signs that boys’ credit accumulation
may be improving over the school years (see Figure 5-8). These findings reveal the ongoing presence of a
gender gap in learning, often described as a result of various socio-cultural and economic factors influencing
boys’ daily life (Booth et al., 2009) as the consistency of the slower paced credit accumulation among boys both
9
across the grades and school years reveal that the problem may be systemic, and thus rooted in challenges
beyond simple accumulation of credits.
Low Credit Accumulation for 2SLGBQA+ students. Students who identify as 2SLGBQA+ face more barriers than
those identifying as heterosexual in accumulating credits. This aligns with larger societal trends that suggest that
schools reflect the experiences of non-marginalized groups (Currie et al., 2021), and that heterosexism (Statistics
Canada, 2019) is an ongoing barrier hindering educational progress. These barriers increase as the students get
older (see Figure 9-12).
Socioeconomic vulnerabilities are a significant barrier to credit accumulation. Across almost all grades and
school years, students who experience very high economic vulnerabilities accumulate fewer credits. This trend
also reinforces the idea that classism is a barrier to student success (Robson et al., 2016) (see Figure 13-16).
Students receiving Special Education Supports. Students with an IEP (identified and non-identified) are less
likely to accumulate credits at pace across all grades; however, this trend improves as students move up in grade
level. Additionally, Grade 9 students accumulated fewer credits in the last two years than the previous school
years suggesting that COVID-19 may have had an impact on students with Special Education Needs facing more
barriers to their learning during this time (Gallagher-Mackay et al., 2021) (see Figure 17-20).
Low credit accumulation for English Language Learners (ELL). English Language Learners, particularly those
receiving ELD support, accumulated fewer credits than their non-ELL counterparts in Grades 9-12 (see Figure 21-
24).
Emerging trends:
Improvement in credit accumulation is evident for some racially marginalized groups. For instance, some
lessening of gaps over the years are evident in the data, including for African, Black, and Afro-Caribbean
students (more have reached the credit accumulation target in later grades compared to grades 9 or 10). This is
the same for Middle Eastern students over the years, though not across grades (see Figure 1-4).
Online learning may have had varying impact on learners of different racial backgrounds. African, Black, and
Afro-Caribbean students across most grade levels consistently show less credit accumulation in more recent
years, suggesting they may have experienced more impact by the disrupted schooling during COVID-19 school
closures. Similar patterns are observed for students who identified with an additional racial background or as
having multiple racial backgrounds (see Figure 1-4).
Improvement in credit accumulation is evident for some 2SLGBQA+ students. These outcomes might be
explained by alternate learning environments due to COVID-19. Compared to pre-school closures, it appears
that their credit accumulation may have improved across the years, with students accruing fewer credits prior to
the beginning of school closures than later when there was a hybrid learning model in place. This trend may
align with prior findings suggesting students who normally experience marginalization or bullying prefer online
learning over in-person environments (PDSB, 2021b) (see Figure 9-12).
COVID-19 impact is more severe on students experiencing socioeconomic vulnerabilities (SVI). Credit
accumulation gaps for students who experience very high SVI have increased over the last three years,
particularly for students in Grade 10. One reason for this might be that COVID-19 may have further exacerbated
the barriers experienced by these students (see Figure 13-16).

10
3.1.2 Indigenous and Racial Identities
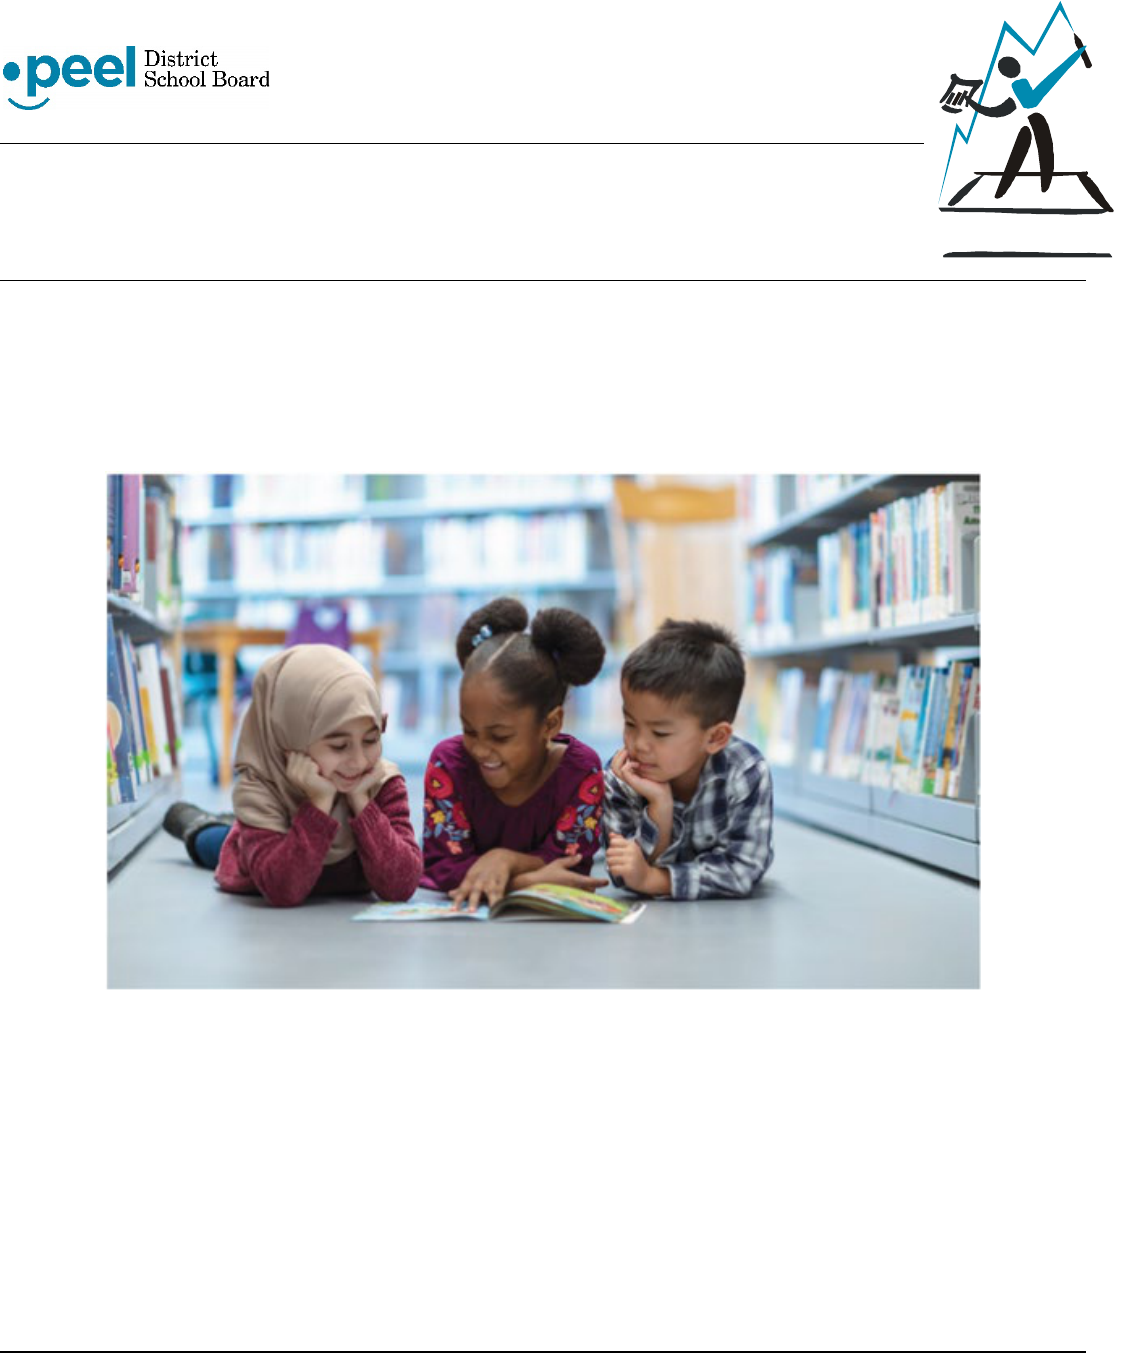
Figure 1 - Students who did not Achieve 8 Credits by the End of Grade 9 by Indigenous and Racial Identity
Figure 2 - Students who did not Achieve 16 Credits by End of Grade 10 by Indigenous and Racial Identity
Figure 3 - Students who did not Achieve 23 Credits by End of Grade 11 by Indigenous and Racial Identity
Figure 4 - Students who did not Achieve 30 Credits by End of Grade 12 by Indigenous and Racial Identity
2.2
0.4
1.0
1.1
1.5
0.7
0.6
1.0
0.9
1.0
2.1
2.3
0.3
N/R
1.0
1.7
0.6
0.7
1.0
1.1
1.6
1.7
2.5
0.3
2.3
2.4
1.2
0.6
0.7
1.2
1.1
1.3
1.7
2.0
0.1
4.1
2.1
1.3
0.6
0.6
1.1
1.6
1.3
1.7
African,
Black &
Afro-Caribbean
East
Asian
First Nations,
Métis
and Inuit
Latinx/
Hispanic
Middle
Eastern
South
Asian
Southeast
Asian
White Additional
Racial
Background
Multiple
Racial
Backgrounds
Did not
disclose
2018-19 2019-20 2020-21 2021-22
- - - - Disproportionate above 1.0
1.9
0.4
2.3
1.7
1.7
0.7
0.5
1.1
1.1
1.0
1.8
2.0
0.3
3.5
1.6
1.6
0.7
0.5
1.1
1.0
1.2
2.0
2.0
0.5
N/R
1.3
1.3
0.6
1.1
1.2
1.5
1.5
1.8
2.1
0.4
2.9
2.1
1.2
0.7
0.7
1.1
1.4
1.3
1.7
African,
Black &
Afro-
Caribbean
East
Asian
First Nations,
Métis
and Inuit
Latinx/
Hispanic
Middle
Eastern
South
Asian
Southeast
Asian
White Additional
Racial
Background
Multiple
Racial
Backgrounds
Did not
disclose
2018-19 2019-20 2020-21 2021-22
- - - - Disproportionate above 1.0
1.7
0.5
4.4
1.4
1.5
0.7
1.1
0.9
0.8
1.2
1.9
1.8
0.5
1.0
1.4
1.8
0.7
0.4
1.1
0.9
1.1
1.7
2.0
0.4
2.8
2.7
1.6
0.6
0.7
1.1
1.0
1.3
1.8
2.0
0.4
N/R
1.2
1.4
0.6
1.0
1.2
1.5
1.6
1.7
African,
Black &
Afro-Caribbean
East
Asian
First Nations,
Métis
and Inuit
Latinx/
Hispanic
Middle
Eastern
South
Asian
Southeast
Asian
White Additional
Racial
Background
Multiple
Racial
Backgrounds
Did not
disclose
2018-19 2019-20 2020-21 2021-22
- - - - Disproportionate above 1.0
1.6
1.1
1.6
2.1
0.7
1.8
0.9
0.5
1.2
1.1
1.5
0.7
5.4
1.5
1.7
0.7
1.2
1.0
1.0
1.2
2.1
1.8
0.6
2.8
2.0
2.0
0.5
0.8
1.3
0.8
1.1
1.6
1.7
0.5
2.9
1.9
1.8
0.6
0.8
1.2
1.2
1.4
1.8
African,
Black &
Afro-
Caribbean
East
Asian
First Nations,
Métis
and Inuit
Latinx/
Hispanic
Middle
Eastern
South
Asian
Southeast
Asian
White Additional
Racial
Background
Multiple
Racial
Backgrounds
Did not
disclose
2018-19 2019-20 2020-21 2021-22
N/R
- - - - Disproportionate above 1.0

11
3.1.3 Gender Identity
Figure 5 - Students who did not Achieve 8 Credits by End of Grade 9
by Gender Identity
Figure 6 - Students who did not Achieve 16 Credits by End of Grade 10
by Gender Identity
Figure 7 - Students who did not Achieve 23 Credits by End of Grade 11
by Gender Identity
Figure 8 - Students who did not Achieve 30 Credits by End of Grade 12
by Gender Identity
3.1.4 Sexual Orientation (Grades 7-12)
Figure 9 - Students who did not Achieve 8 Credits by End of Grade 9
by Sexual Orientation
* Sexual orientation of Grade 9 students in 2021-22 is not available.
Figure 10 - Students who did not Achieve 16 Credits by End of Grade 10
by Sexual Orientation
Figure 11 - Students who did not Achieve 23 Credits by End of Grade
11 by Sexual Orientation
Figure 12 - Students who did not Achieve 30 Credits by End of Grade 12
by Sexual Orientation
0.8
1.7
1.2
2.0
0.8
3.0
1.2
1.9
0.8
1.8
1.2
2.0
0.9
2.9
1.1
1.6
Female Diverse Gender
Identity
Male Did not disclose
2018-19 2019-20 2020-21 2021-22
- - - - Disproportionate above 1.0
0.7
2.6
1.2
0.8
0.7
1.9
1.2
1.3
0.8
2.5
1.1
1.4
0.9
1.8
1.1
1.7
Female Diverse Gender
Identity
Male Did not disclose
2018-19 2019-20 2020-21 2021-22
- - - - Disproportionate above 1.0
0.7
1.6
1.2
1.2
0.7
3.1
1.2
0.8
0.7
2.1
1.2
1.4
0.8
1.6
1.2
1.6
Female Diverse Gender
Identity
Male Did not disclose
2018-19 2019-20 2020-21 2021-22
- - - - Disproportionate above 1.0
0.8
1.7
1.2
1.0
0.7
1.8
1.2
1.6
0.7
4.7
1.2
1.3
0.8
2.1
1.2
1.1
Female Diverse Gender
Identity
Male Did not disclose
2018-19 2019-20 2020-21 2021-22
- - - - Disproportionate above 1.0
1.3
0.9
2.1
1.2
0.9
1.0
1.1
1.0
1.4
N/A*
N/A
N/A
1
2SLGBQA+ Heterosexual/Straight Did not disclose
2018-19 2019-20 2020-21 2021-22
- - - - Disproportionate above 1.0
1.4
0.9
1.4
1.3
0.9
1.5
1.2
0.9
0.8
1.1
1.0
1.2
2SLGBQA+ Heterosexual/Straight Did not disclose
2018-19 2019-20 2020-21 2021-22
- - - - Disproportionate above 1.0
1.4
0.9
1.5
1.3
0.9
1.5
1.3
0.9
1.3
1.3
0.9
1.3
2SLGBQA+ Heterosexual/Straight Did not disclose
2018-19 2019-20 2020-21 2021-22
- - - - Disproportionate above 1.0
1.7
0.8
2.1
1.6
0.9
1.4
1.8
0.9
0.9
1.5
0.9
1.4
2SLGBQA+ Heterosexual/Straight Did not disclose
2018-19 2019-20 2020-21 2021-22
- - - - Disproportionate above 1.0

12
3.1.5 Socioeconomic Vulnerability Clusters
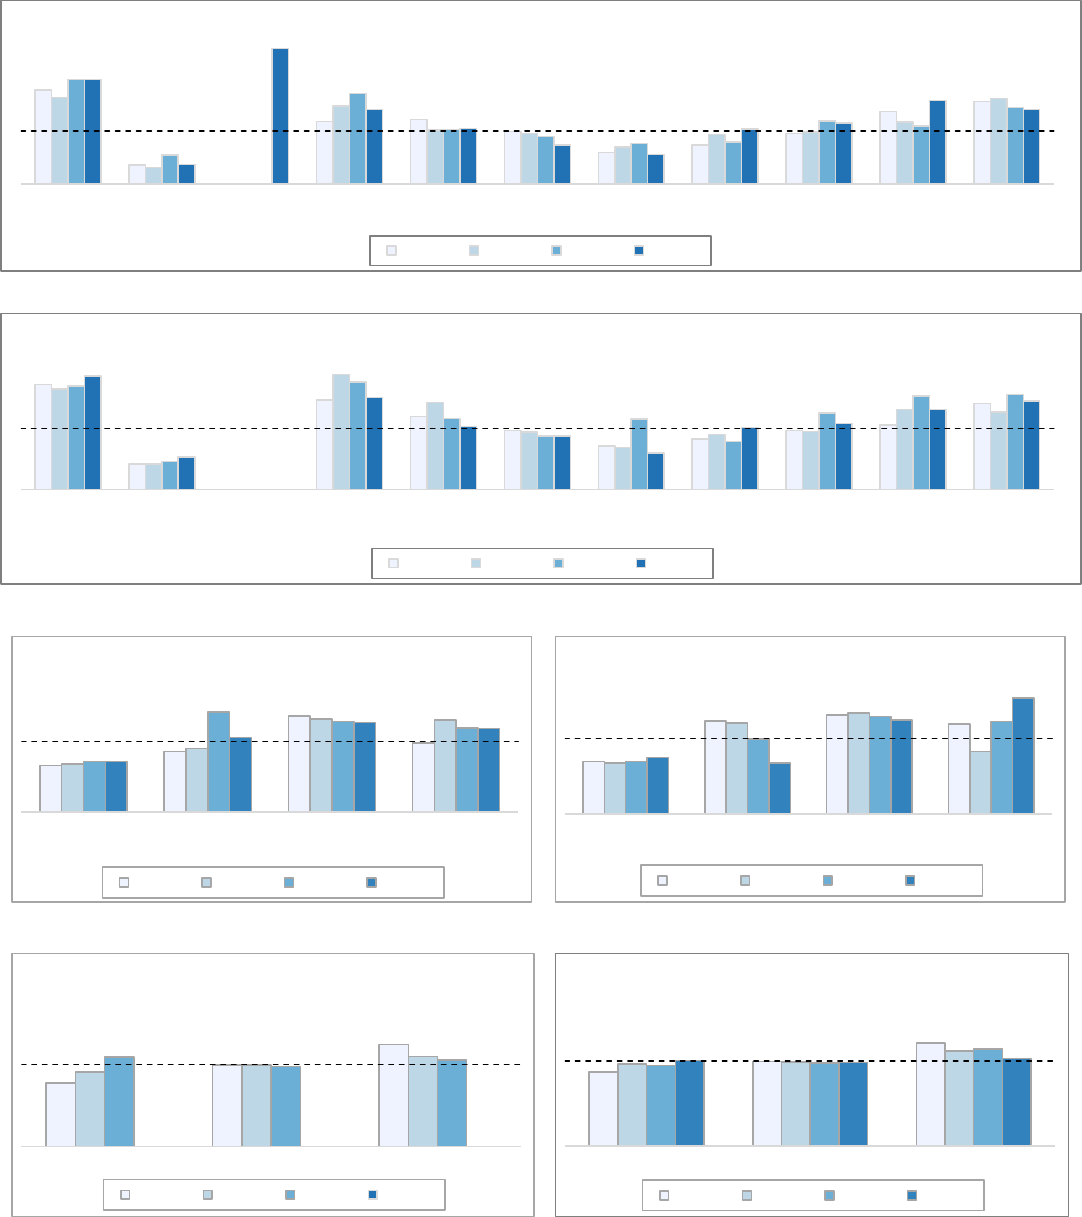
Figure 13 - Students who did not Achieve 8 Credits by End of Grade 9 by Socioeconomic Vulnerability Cluster
Figure 14 - Students who did not Achieve 16 Credits by End of Grade 10 by Socioeconomic Vulnerability Cluster
Figure 15 - Students who did not Achieve 23 Credits by End of Grade 11 by Socioeconomic Vulnerability Cluster
Figure 16 - Students who did not Achieve 30 Credits by End of Grade 12 by Socioeconomic Vulnerability Cluster
0.7
0.8
0.9
1.1
1.2
1.9
0.5
0.7
0.9
1.1
1.2
2.3
0.5
0.8
1.0
1.1
1.2
2.1
0.6
0.8
0.8
1.1
1.4
2.1
Low Somewhat Low Moderate Somewhat High High Very High
2018-19 2019-20 2020-21 2021-22
- - - - Disproportionate above 1.0
0.7
0.8
0.9
1.1
1.2
1.7
0.7
0.9
0.9
1.0
1.3
1.9
0.6
0.8
0.9
1.0
1.2
2.0
0.6
0.8
1.0
1.0
1.1
2.0
Low Somewhat Low Moderate Somewhat High High Very High
2018-19 2019-20 2020-21 2021-22
- - - - Disproportionate above 1.0
0.7
0.8
0.9
1.0
1.2
2.0
0.7
0.8
0.9
1.1
1.4
1.7
0.5
0.8
1.0
0.9
1.3
2.0
0.6
0.8
0.9
0.9
1.2
2.0
Low Somewhat Low Moderate Somewhat High High Very High
2018-19 2019-20 2020-21 2021-22
- - - - Disproportionate above 1.0
0.8
0.9
0.8
1.0
1.2
1.8
0.7
0.9
0.8
1.0
1.2
1.8
0.8
0.8
0.9
1.1
1.3
1.8
0.6
0.8
0.9
1.0
1.3
1.9
Low Somewhat Low Moderate Somewhat High High Very High
2018-19 2019-20 2020-21 2021-22
- - - - Disproportionate above 1.0

13
3.1.6 Students with Special Education Needs
Figure 17 - Students who did not Achieve 8 Credits by End of Grade 9
by Individual Education Plan (IEP) Status
Figure 18 - Students who did not Achieve 16 Credits by End of Grade
10 by Individual Education Plan (IEP) Status
Figure 19 - Students who did not Achieve 23 Credits by End of Grade 11
by Individual Education Plan (IEP) Status
Figure 20 - Students who did not Achieve 30 Credits by End of Grade
12 by Individual Education Plan (IEP) Status
3.1.7 English Language Learners
Figure 21 - Students who did not Achieve 8 Credits by End of Grade 9 by
English Language Learner Status
Figure 22 - Students who did not Achieve 16 Credits by End of Grade
10 by English Language Learner Status
Figure 23 - Students who did not Achieve 23 Credits by End of Grade 11
by English Language Learner Status
Figure 24 - Students who did not Achieve 30 Credits by End of Grade
12 by English Language Learner Status
2.3
0.9
2.4
0.9
2.8
0.8
2.7
0.9
IEP No IEP
2018-19 2019-20 2020-21 2021-22
- - - - Disproportionate above 1.0
2.2
0.9
2.1
0.9
2.2
0.9
2.2
0.9
IEP No IEP
2018-19 2019-20 2020-21 2021-22
- - - - Disproportionate above 1.0
1.9
0.9
2.2
0.9
2.2
0.9
2.0
0.9
IEP No IEP
2018-19 2019-20 2020-21 2021-22
- - - - Disproportionate above 1.0
1.4
0.9
1.5
0.9
2.0
0.9
1.7
0.9
IEP No IEP
2018-19 2019-20 2020-21 2021-22
- - - - Disproportionate above 1.0
5.7
2.4
0.9
8.7
2.8
0.8
7.4
2.3
0.9
6.8
3.3
0.9
ELD ESL Not ELL
2018-19 2019-20 2020-21 2021-22
- - - - Disproportionate above 1.0
4.6
2.3
0.9
6.1
2.6
0.8
6.0
2.6
0.9
5.1
2.4
0.9
ELD ESL Not ELL
2018-19 2019-20 2020-21 2021-22
- - - - Disproportionate above 1.0
5.1
2.4
0.9
5.2
2.3
0.8
6.7
2.6
0.8
6.1
2.7
0.9
ELD ESL Not ELL
2018-19 2019-20 2020-21 2021-22
- - - - Disproportionate above 1.0
5.5
3.0
0.8
6.1
3.2
0.8
6.5
2.8
0.8
6.5
3.2
0.8
ELD ESL Not ELL
2018-19 2019-20 2020-21 2021-22
- - - - Disproportionate above 1.0
14
3.2 Grades 9 and 10 Literacy and Numeracy
3.2.1 Summary of Outcomes
Needs:
Disproportionate Outcomes by Racial Background. African, Black, and Afro-Caribbean, Indigenous and
Latinx/Hispanic students are the most likely to be assessed below Levels 3 or 4 in Grade 9 and 10 Academic
English. These findings indicate that while de-streaming Grade 9 Mathematics and English courses may remove
some barriers, likely there are prior gaps in access to learning that continue to disadvantage some students (see
Figure 25-26 and Figure 37-38).
Literacy versus numeracy challenges. Students who identify as Latinx/Hispanic and Middle Eastern have higher
rates of disproportionate experiences in Grade 9 and 10 Academic English than Academic/de-streamed
Mathematics. These outcomes are also likely a result of gaps in prior access to learning (see Figure 25-26, and
Figure 37-38).
Students who identify with a diverse gender identity may be struggling in English and Mathematics. The
population sizes of these groups are relatively small when looking at grade-level outcomes so individual positive
or negative outcomes may have impacted the trends displayed in these graphs. Given the trends and
experiences of the larger population, assumptions can be made that these students are experiencing barriers to
their success (see Figure 27-28, and Figure 39-40).
Girls outperform boys in Literacy. Girls were consistently assessed at or above the Provincial Standard (Levels 3
or 4) more often than boys (see Figure 27-28, and Figure 39-40).
Socioeconomic vulnerabilities impact English learning. Students who experience very high socioeconomic
vulnerabilities are less likely to be assessed at the Provincial Standard of Level 3 or 4 in Academic English. This
disproportionate outcome has increased during the last three years (see Figure 31-32).
Students receiving Special Education Supports. Students who have an IEP and may or may not have a formal
identification are almost two times less likely to be assessed at or above the Provincial Standard in comparison
with students who do not have an IEP. This gap is more notable for Academic English outcomes (see Figure 33-
34, and Figure 45-46).
English Language Learners. ELLs are one and half to two times more likely to be assessed not at or above
Provincial Standard (Levels 3 or 4) in Academic English or Academic/De-streamed Mathematics compared to
non-ELLs (see Figure 35-36 and Figure 47-48).
Emerging Trends:
COVID-19 may have affected some students’ academic achievements more than others: Students who identify
as African, Black, and Afro-Caribbean are less likely to be assessed at Level 3 and 4 in grade 9 and 10 Academic
English in comparison to their pre-COVID-19 learning (2018-19), suggesting that the barriers they are
experiencing have remained and worsened (see Figure 25-26).
Slight improvement for boys in literacy. The disproportionate outcomes for boys in Grade 9 and 10 Academic
English appear to be decreasing (see Figure 27-28).
2SLGBQA+ Students doing well in literacy and numeracy. Trends suggest that students who identify as
2SLGBQA+ do as well as their heterosexual classmates (see Figure 29-30, and Figure 41-42).
Students with an IEP need support to be successful in de-streamed classes. Trends suggest that students who
have an IEP may need more support to achieve the Provincial Standard (Levels 3 or 4) in both grades 9 and 10
Academic/De-streamed English and Mathematics (see
Figure 33-34 and Figure 45-46).
15
3.2.2 Literacy Outcomes
Figure 25 - Students in Grade 9 Academic English Not Achieving Level 3 or 4 by Indigenous and Racial Identities
Figure 26 - Students in Grade 10 Academic English Not Achieving Level 3 or 4 by Indigenous and Racial Identities
Figure 27 - Students in Grade 9 Academic English Not Achieving Level 3
or 4 by Gender Identity
Figure 28 - Students in Grade 10 Academic English Not Achieving Level
3 or 4 by Gender Identity
Figure 29 - Students in Grade 9 Academic English Not Achieving Level 3
or 4 by Sexual Orientation
* Sexual orientation of Grade 9 students in 2021-22 is not available.
Figure 30 - Students in Grade 10 Academic English Not Achieving Level
3 or 4 by Sexual Orientation
1.8
0.4
1.2
1.2
1.0
0.6
0.7
0.9
1.4
1.5
1.6
0.3
N/R
1.5
1.0
1.0
0.7
0.9
1.0
1.2
1.6
2.0
0.5
1.7
1.0
0.9
0.8
0.8
1.2
1.1
1.4
2.0
0.4
2.5
1.4
1.0
0.7
0.6
1.0
1.2
1.6
1.4
African,
Black &
Afro-Caribbean
East
Asian
First Nations,
Métis &
Inuit
Latinx/
Hispanic
Middle
Eastern
South
Asian
Southeast
Asian
White Multiple
Racial
Backgrounds
Additional
Racial
Background
Did not
disclose
2018-19 2019-20 2020-21 2021-22
- - - - Disproportionate above 1.0
1.7
0.4
1.5
1.2
1.0
0.7
0.8
1.0
1.1
1.4
1.7
0.4
1.9
1.4
0.9
0.7
0.9
0.9
1.3
1.3
1.7
0.5
N/R
1.8
1.2
0.9
1.2
0.8
1.3
1.5
1.6
1.9
0.5
1.5
1.0
0.9
0.6
1.0
1.1
1.3
1.5
African,
Black &
Afro-
Caribbean
East
Asian
First Nations,
Métis &
Inuit
Latinx/
Hispanic
Middle
Eastern
South
Asian
Southeast
Asian
White Multiple
Racial
Backgrounds
Additional
Racial
Background
Did not
disclose
2018-19 2019-20 2020-21 2021-22
- - - - Disproportionate above 1.0
0.7
0.9
1.4
1.0
0.7
0.9
1.3
1.3
0.7
1.4
1.3
1.2
0.7
1.1
1.3
1.2
Female Diverse gender
Identity
Male Did not disclose
2018-19 2019-20 2020-21 2021-22
- - - - Disproportionate above 1.0
0.7
1.2
1.3
1.2
0.7
1.2
1.3
0.8
0.7
1.0
1.3
1.2
0.7
0.7
1.2
1.5
Female Diverse Gender
Identity
Male Did not disclose
2018-19 2019-20 2020-21 2021-22
- - - - Disproportionate above 1.0
0.8
1.0
1.2
0.9
1.0
1.1
1.1
1.0
1.1
N\A*
N\A
N\A
2SLGBQA+ Heterosexual/Straight Did not disclose
2018-19 2019-20 2020-21 2021-22
- - - - Disproportionate above 1.0
0.9
1.0
1.2
1.0
1.0
1.1
0.9
1.0
1.1
1.0
1.0
1.0
2SLGBQA+ Heterosexual/Straight Did not disclose
2018-19 2019-20 2020-21 2021-22
- - - - Disproportionate above
1.0

16
Figure 31 - Students in Grade 9 Academic English Not Achieving Level 3 or 4 by Socioeconomic Vulnerability Cluster
Figure 32 - Students in Grade 10 Academic English Not Achieving Level 3 or 4 by Socioeconomic Vulnerability Cluster
Figure 33 - Students in Grade 9 Academic English Not Achieving Level
3 or 4 by IEP Status
Figure 34 - Students in Grade 10 Academic English Not Achieving Level 3
or 4 by Students with an IEP Status
Figure 35 - Students in Grade 9 Academic English Not Achieving Level
3 or 4 by ELL Status
Figure 36 - Students in Grade 10 Academic English Not Achieving
Level 3 or 4 by ELL Status
0.8
0.9
1.1
1.1
1.1
1.1
0.8
0.9
1.1
1.1
1.0
1.3
0.6
0.8
1.1
1.1
1.1
1.6
0.6
0.8
1.0
1.1
1.2
1.6
Low Somewhat Low Moderate Somewhat High High Very High
2018-19 2019-20 2020-21 2021-22
- - - - Disproportionate above 1.0
0.8
1.0
1.0
1.2
1.0
1.2
0.8
0.9
1.0
1.1
1.0
1.3
0.7
1.0
1.0
1.1
1.1
1.5
0.7
0.9
1.1
1.1
1.1
1.5
Low Somewhat Low Moderate Somewhat High High Very High
2018-19 2019-20 2020-21 2021-22
- - - - Disproportionate above 1.0
1.6
1.0
1.8
1.0
1.7
1.0
2.1
0.9
IEP No IEP
2018-19 2019-20 2020-21 2021-22
- - - - Disproportionate above 1.0
1.8
1.0
2.0
1.0
1.6
1.0
1.8
1.0
IEP No IEP
2018-19 2019-20 2020-21 2021-22
- - - - Disproportionate above 1.0
1.9
1.0
2.1
1.0
1.9
1.0
2.1
1.0
ELL Not ELL
2018-19 2019-20 2020-21 2021-22
- - - - Disproportionate above 1.0
2.0
1.0
1.7
1.0
2.0
1.0
2.3
1.0
ELL Not ELL
2018-19 2019-20 2020-21 2021-22
- - - - Disproportionate above 1.0

17
3.2.3 Numeracy Outcomes
Figure 37 - Students in Grade 9 Academic Mathematics Not Achieving Level 3 or 4 by Indigenous and Racial Identities
Figure 38 - Students in Grade 10 Academic Mathematics Not Achieving Level 3 or 4 by Indigenous and Racial Identities
Figure 39 - Students in Grade 9 Academic Mathematics Not Achieving
Level 3 or 4 by Gender Identity
Figure 40 - Students in Grade 10 Academic Mathematics Not
Achieving Level 3 or 4 by Gender Identity
Figure 41 - Students in Grade 9 Academic Mathematics Not Achieving
Level 3 or 4 by Sexual Orientation
* Sexual orientation of Grade 9 students in 2021-22 is not available.
Figure 42 - Students in Grade 10 Academic Mathematics Not
Achieving Level 3 or 4 by Sexual Orientation
1.8
0.3
1.4
1.2
1.0
0.7
0.9
1.0
1.3
1.3
1.6
0.3
1.3
1.0
0.9
0.8
1.0
1.1
1.6
1.4
1.9
0.4
N/R
0.9
1.1
0.9
0.7
1.1
1.3
1.0
1.3
1.9
0.3
2.7
1.7
1.1
0.7
0.8
1.1
1.2
1.7
1.4
African,
Black &
Afro-
Caribbean
East
Asian
First Nations,
Métis &
Inuit
Latinx/
Hispanic
Middle
Eastern
South
Asian
Southeast
Asian
White Multiple
Racial
Backgrounds
Additional
Racial
Background
Did not
disclose
2018-19 2019-20 2020-21 2021-22
- - - - Disproportionate above 1.0
1.6
0.3
1.4
1.1
1.0
0.6
1.0
1.1
1.2
1.4
1.6
0.3
1.5
1.0
1.0
0.7
1.0
1.0
1.3
1.2
1.9
0.3
N/R
1.3
1.0
0.9
0.8
0.9
1.2
1.4
1.4
1.8
0.4
0.8
1.2
0.9
0.5
0.9
1.1
1.3
1.4
African,
Black &
Afro-
Caribbean
East
Asian
First Nations,
Métis &
Inuit
Latinx/
Hispanic
Middle
Eastern
South
Asian
Southeast
Asian
White Multiple
Racial
Backgrounds
Additional
Racial
Background
Did not
disclose
2018-19 2019-20 2020-21 2021-22
- - - - Disproportionate above 1.0
1.0
1.0
1.0
0.8
0.9
0.9
1.1
0.9
0.9
1.5
1.1
1.5
0.9
1.8
1.0
1.2
Female Diverse gender
Identity
Male Did not disclose
2018-19 2019-20 2020-21 2021-22
- - - - Disproportionate above 1.0
0.7
1.2
1.3
1.2
0.7
1.2
1.3
0.8
0.7
1.0
1.3
1.2
0.7
0.7
1.2
1.5
Female Diverse Gender
Identity
Male Did not disclose
2018-19 2019-20 2020-21 2021-22
- - - - Disproportionate above 1.0
0.9
1.0
1.2
1.0
1.0
1.0
1.0
1.0
1.0
N\A*
N\A
N\A
2SLGBQA+ Heterosexual/Straight Did not disclose
2018-19 2019-20 2020-21 2021-22
- - - - Disproportionate above 1.0
1.0
1.0
1.0
0.9
1.0
1.1
1.2
1.0
1.0
1.1
1.0
1.0
2SLGBQA+ Heterosexual/Straight Did not disclose
2018-19 2019-20 2020-21 2021-22
- - - - Disproportionate above 1.0
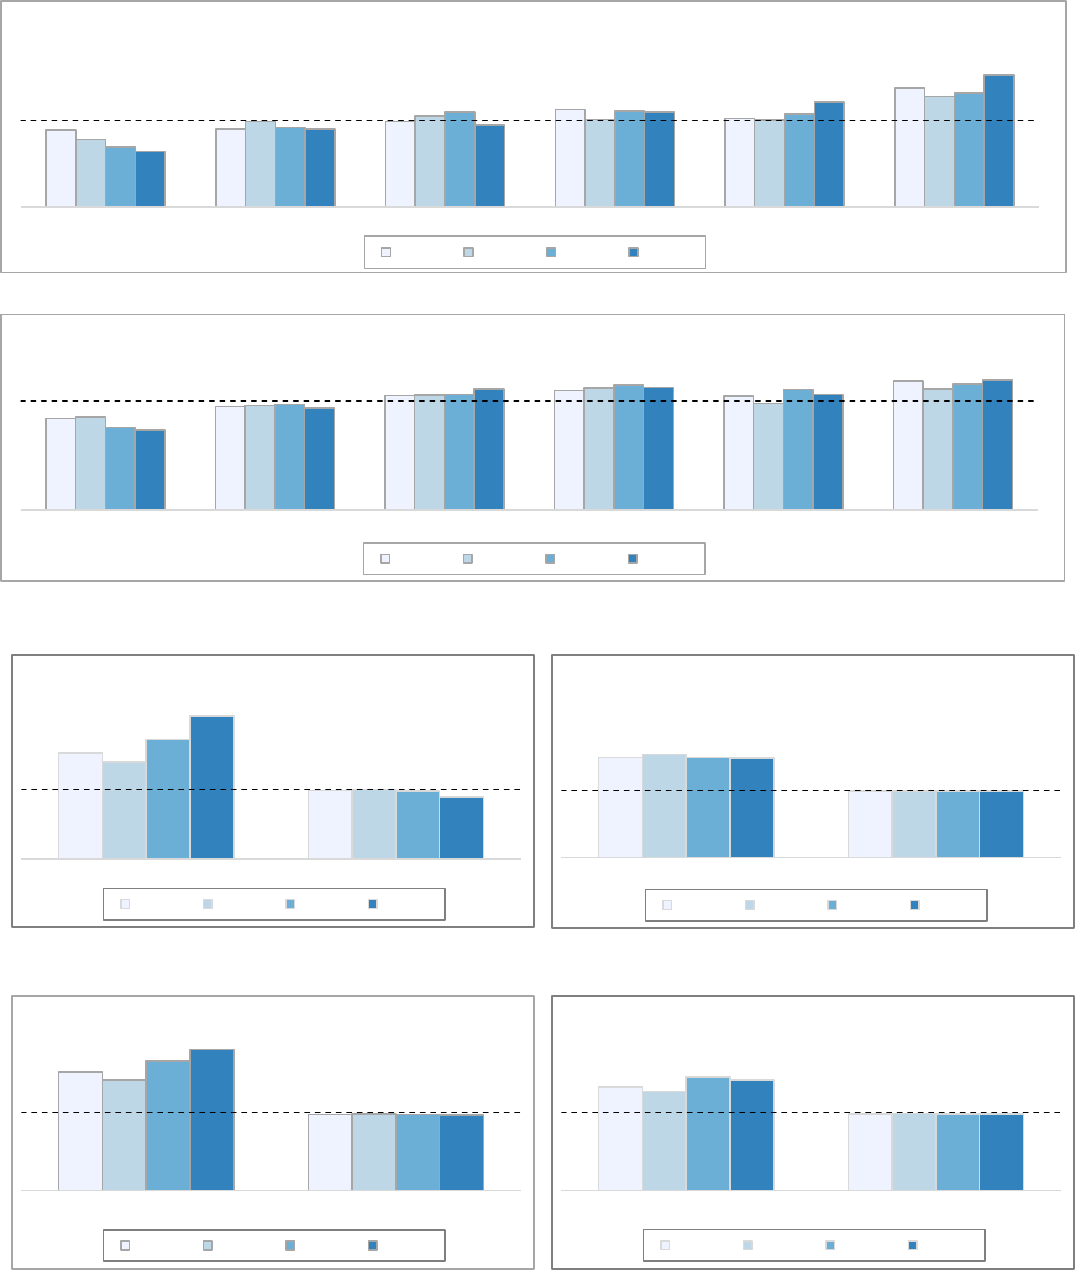
18
Figure 43 - Disproportionality Index of Students in Grade 9 Academic Math Not Achieving Level 3 or 4 by Socioeconomic Vulnerability Cluster
Figure 44 - Disproportionality Index of Students in Grade 10 Academic Math Not Achieving Level 3 or 4 by Socioeconomic Vulnerability Cluster
Figure 45 - Students in Grade 9 Academic Mathematics Not Achieving
Level 3 or 4 by Students with an IEP Status
Figure 46 - Students in Grade 10 Academic Mathematics Not Achieving
Level 3 or 4 by Students with an IEP Status
Figure 47 - Students in Grade 9 Academic Mathematics Not Achieving
Level 3 or 4 by ELL Status
Figure 48 - Students in Grade 10 Academic Mathematics Not Achieving
Level 3 or 4 by ELL Status
0.9
0.9
1.0
1.1
1.0
1.4
0.8
1.0
1.1
1.0
1.0
1.3
0.7
0.9
1.1
1.1
1.1
1.3
0.6
0.9
0.9
1.1
1.2
1.5
Low Somewhat Low Moderate Somewhat High High Very High
2018-19 2019-20 2020-21 2021-22
- - - - Disproportionate above 1.0
0.8
0.9
1.1
1.1
1.0
1.2
0.9
1.0
1.1
1.1
1.0
1.1
0.8
1.0
1.1
1.1
1.1
1.2
0.7
0.9
1.1
1.1
1.1
1.2
Low Somewhat Low Moderate Somewhat High High Very High
2018-19 2019-20 2020-21 2021-22
- - - - Disproportionate above 1.0
1.5
1.0
1.4
1.0
1.7
1.0
2.1
0.9
IEP No IEP
2018-19 2019-20 2020-21 2021-22
- - - - Disproportionate above 1.0
1.5
1.0
1.5
1.0
1.5
1.0
1.5
1.0
IEP No IEP
2018-19 2019-20 2020-21 2021-22
- - - - Disproportionate above 1.0
1.5
1.0
1.4
1.0
1.7
1.0
1.8
1.0
ELL Not ELL
2018-19 2019-20 2020-21 2021-22
- - - - Disproportionate above 1.0
1.3
1.0
1.3
1.0
1.5
1.0
1.4
1.0
ELL Not ELL
2018-19 2019-20 2020-21 2021-22
- - - - Disproportionate above 1.0
19
4.0 Human Rights and Equity
4.1 Student Discipline
4.1.1 Literature Review
Suspensions, expulsions and exclusions are discipline practices that require students to be removed from the classroom
or school environment for a specified amount of time (Coles & Powell, 2020; Finigan-Carr, 2017; Lindsay & Hart, 2017).
Suspensions are often used as a form of punishment to deter students from future engagement in such behaviour and
to “discourage [their] peers from engaging in similar conduct” (Costenbader & Markson, 1998, cited in Chu & Ready,
2018, p. 479). Research suggests, however, that suspensions often serve as an entry point to the school-to-prison
pipeline, whereby students, primarily African, Black and Afro-Caribbean, Indigenous and racialized, are pushed out of
school and into the criminal justice system (Adamu & Hogan, 2015; Wun, 2016). African, Black and Afro-Caribbean
students are disproportionately vulnerable to these adverse outcomes. Likewise, students with Special Education
Needs, those of lower socioeconomic status, Indigenous backgrounds, as well as males, face greater implications of
suspensions than others (Cholewa et al., 2018; Greflund, et al., 2014; Skiba et al., 2011; Sullivan et al., 2014).
Overrepresentation of African, Black and Afro-Caribbean students in suspension data has raised concerns that
suspension policies are “inherently anti-Black" (Coles & Powell, 2020, p. 114), and consequently operate to remove or
exclude African, Black and Afro-Caribbean children and youth from schools.
Exclusionary discipline has long-term impacts on student learning outcomes as those suspended in earlier years are
more likely to face future disciplining as well as school dropouts (Meek & Gilliam, 2016; Yang et al, 2018). Research
suggests that students who are suspended between grades 7-12 are more likely to experience victimization, engage in
criminal activity, and be incarcerated, especially African, Black and Afro-Caribbean students (Wolf & Kupchik, 2017).
Indigenous students also experience disproportionate discipline, with research suggesting cultural bias as a key factor
(Greflund et al., 2014). Suspensions are nominally used to support sustaining positive and safe classroom and school
climates. However, research reveals that suspensions do not lead to improvement in student behaviour (Petras et al.,
2011; Paul & Araneo, 2019).
A suspension can range from one to 20 school days, with more than 5 days representing a long-term suspension (Glisic &
Favaro, 2017).
Expelled students, on the other hand, are removed from school for an indefinite time. They can be
expelled from their own school or from all schools in their school board (Ontario Education and Training, 2022). A school
principal may exclude a student if, in their judgement, they determine the student’s presence is “detrimental” to the
“physical or mental wellbeing” of students in the school (Government of Ontario, 1990).
Special education has drawn critique as being complicit in segregation across racial, class, and disability status (Parekh &
Brown, 2019). Research indicates clear evidence of over representation of African, Black and Afro-Caribbean and
racialized students within special education classes, pointing to a stronger focus on individual characteristics than on
educational potential and attainment (Artiles et al., 2002; De Valenzuela et al., 2006; James & Turner, 2017; Kramarczuk
Voulgarides et al., 2017; Losen et al., 2014; Parekh et al., 2018; Parekh et al., 2021).
Racialized students are overrepresented in every special education category including emotional/behavioural disorders,
learning disabilities, intellectual disabilities, and speech and language disorders (Kramarczuk Vougarides et al., 2017). In
PDSB’s 2021 Annual Equity Accountability Report Card: Baseline Data on the Equity Gap in Student Outcomes, it was
found that African, Black and Afro-Caribbean students are approximately two times more likely to be identified with
Special Education Needs than their presence in the overall PDSB student population would predict. Additionally, African,
Black and Afro-Caribbean students of all SVI levels are overrepresented among the students with identified Special
Education Needs.
Research also highlights the intersection between race, special education placement, and student discipline. African,
Black and Afro-Caribbean students have been found to be overrepresented in special education categories that predict
increased suspensions while underrepresented in those that predict lower suspension rates (Losen et al., 2014). To
20
illustrate, Krezmien, Leone, & Achilles (2006) found that African, Black and Afro-Caribbean students with
emotional and
behavioural Special Education Needs disproportionately experience suspensions (as cited in Haight et al., 2016). African,
Black and Afro-Caribbean students have also been overrepresented in instances of suspension when compared to
expulsions (Kramarczuk Vougarides et al., 2017; Noltemeyer & Mcloughlin, 2010). Expulsions typically require less
subjective judgement, indicating African, Black and Afro-Caribbean students may be targeted for minor behavioural
incidents resulting in higher suspension rates (Kramarczuk Vougarides et al., 2017; Noltemeyer & Mcloughlin, 2010).
African, Black and Afro-Caribbean students have echoed these concerns, noting a “double standard” in how African,
Black and Afro-Caribbean and white students are treated within the classroom. More generally, students report that
differential discipline processes are used for African, Black and Afro-Caribbean students with some noting that white
students were often not disciplined for disruptive behaviours in class whereas Black students were. Moreover, African,
Black and Afro-Caribbean students reported receiving more severe consequences for the same behaviours (James,
2019a). It is important to note that the overrepresentation of African, Black and Afro-Caribbean students in suspension
data has not been found to be a result of their misbehaviour more than other racial groups (Gregory et al., 2010).
4.1.2 Summary of Outcomes
In May 2020, the Peel board proactively ordered the cessation of all informal/in school suspensions and all suspensions
of students in kindergarten to grade 3. In December 2020, the board further directed that suspension records of all
students in kindergarten to grade 3 be expunged where legally permissible. In March 2021 an interim policy was
presented, and in May 2021, the expungement process was initiated. This report does not include these expunged
records.
There was a very low number of suspensions (124) in 2020-21. The disaggregated outcomes have not been suppressed;
however, caution should be taken when interpreting the results. The unexpected outcomes may be explained by
randomness rather than systemic patterns.
Needs:
Older students are suspended more than others. Students in Grades 7-12 appear more likely to be suspended
with a notable increase in disproportionate outcomes for students in Grades 7 and 8 for 2021-22 (see Figure 49).
Disproportionate suspensions for African, Black, and Afro-Caribbean and Indigenous students despite
decrease in overall suspensions. While there is a reduction in the number of suspensions in 2021-22 compared
to 2018-19, African, Black, and Afro-Caribbean and Indigenous students continue to be more than two-times
more likely to be suspended (see Figure 50).
Consistent over-representation of marginalized students among those suspended. Students who identify as
Middle Eastern and Latinx/Hispanic are consistently about one and a half times more likely to receive a
suspension (see Figure 50).
Gender. Boys are about two times more likely to be suspended than girls (see Figure 51).
Multiple identities impacting some students. Consider the potential intersecting identities impacted by gender,
race, socioeconomic vulnerabilities, and Special Education Needs that can play a significant role in students
being excluded from classrooms and learning (see Figure 50-51 and Figure 53-54).
High socioeconomic vulnerabilities cause barriers to accessing learning. Students who experience very high
socioeconomic vulnerabilities are about one and half times more likely to receive a suspension (see Figure 53).
Students receiving English Literacy Development need more supports. Students who are new to Canada and
have and continue to experience a variety of vulnerabilities are more than four times more likely to receive a
suspension (see Figure 55).
Students with Special Education needs experience barriers to learning. Students who have an IEP are more
than three times more likely to be suspended (see Figure 54). Students identified with an exceptionality that
does not require a medical doctor diagnosis (behavioural, Language Impairment, Learning Disability, Mild
Intellectual Disability) and therefore is more subjective are even more likely to receive a suspension (see Figure
56).

21
Emerging Trends:
The number of suspensions is decreasing. From 2018-19 to 2019-2020 the number of suspensions was almost
cut in half. In 2020-21 there were a marked reduction in the number of suspensions due to school closures
during the pandemic. However, as schools re-opened in 2021-22, the number of suspensions was half of what it
was in 2019-20 prior to closures. In this case, outcomes may be a result of randomness rather than systemic
patterns (see Table 1).
The number of expulsions increased. In 2021-22 there were substantially more expulsions than in prior years.
The number of expulsions is very small and therefore trends should be considered with caution.
4.1.2 Discipline Outcomes
Table 1. Suspensions, Expulsions and Exclusions
School Year
Number of
Suspensions
Number of Students
Suspended
Number of Expulsions
Number of Students
Excluded
2018-19
4094
2875
2
34
2019-20
2654
2063
3
19
2020-21
124
114
1
11
2021-22
1027
862
14
11
Figure 49 - Students who Received One or More Suspensions by Grade
Figure 50 - Students who Received One or More Suspensions by Indigenous and Racial Identities
0.0
0.5
1.3
2.5
0.0
0.4
1.2
2.4
0.0
1.2
3.0
1.0
0.0
0.5
2.1
1.9
Grade K-3 Grade 4-6 Grade 7-8 Grade 9-12
2018-19 2019-20 2020-21 2021-22
- - - - Disproportionate above 1.0
2.7
0.4
3.1
1.5
1.4
0.6
0.4
1.2
1.3
1.2
1.1
2.2
0.5
3.9
1.7
1.6
0.7
0.5
1.1
1.4
1.1
1.1
0.7
0.8
0.0
0.0
1.6
0.5
0.0
2.8
1.3
1.0
1.6
2.5
0.3
6.7
0.7
1.5
0.6
0.3
1.3
1.0
1.2
1.5
African,
Black &
Afro-
Caribbean
East
Asian
First Nations,
Métis
and Inuit
Latinx/
Hispanic
Middle
Eastern
South
Asian
Southeast
Asian
White Additional
Racial
Background
Multiple
Racial
Backgrounds
Did not
disclose
2018-19 2019-20 2020-21 2021-22
- - - - Disproportionate above 1.0

22
Figure 51 - Students who Received One or More Suspensions
by Gender Identity
Figure 52 - Students in Grades 7-12 who Received One or More
Suspensions by Sexual Orientation
Figure 53 - Students who Received One or More Suspensions by Socioeconomic Vulnerability Clusters
Figure 54 - Students who Received One or More Suspensions
by IEP Status
Figure 55 - Students who Received One or More Suspensions
by ELL Status
Figure 56 - Students who Received One or More Suspensions by Special Education Exceptionality
0.5
2.4
1.5
1.1
0.4
2.0
1.5
1.4
0.1
7.6
1.8
1.2
0.5
1.6
1.4
1.5
Female Diverse Gender
Identity
Male Did not disclose
2018-19 2019-20 2020-21 2021-22
- - - - Disproportionate above 1.0
1.0
1.1
0.6
0.9
1.2
0.6
1.3
0.6
1.4
0.4
1.0
1.0
2SLGBA+ Heterosexual/Straight Did not disclose
2018-19 2019-20 2020-21 2021-22
- - - - Disproportionate above 1.0
0.8
0.8
0.9
1.1
1.1
1.6
0.8
0.8
0.9
1.0
1.2
1.7
1.5
1.3
0.9
0.9
1.2
1.4
0.8
0.8
1.0
1.0
0.9
1.8
Low Somewhat Low Moderate Somewhat High High Very High
2018-19 2019-20 2020-21 2021-22
- - - - Disproportionate above 1.0
3.1
0.7
3.4
0.7
3.1
0.7
3.3
0.7
IEP No IEP
2018-19 2019-20 2020-21 2021-22
- - - - Disproportionate above 1.0
4.3
0.5
1.3
5.9
0.5
1.3
4.6
0.8
1.1
4.2
0.7
1.1
ELD ESL Not ELL
2018-19 2019-20 2020-21 2021-22
- - - - Disproportionate above 1.0
13.3
1.2
0.6
5.5
4.2
0.2
0.7
5.4
0.0
0.0
0.8
15.0
1.8
0.9
6.6
4.3
0.0
0.5
6.4
1.7
1.0
0.8
29.3
0.8
0.0
3.9
4.8
0.0
1.1
2.3
0.0
0.0
0.8
11.7
0.7
0.0
5.7
5.5
0.3
0.7
2.6
2.4
0.0
0.8
Behavioural Autism Hard
of Hearing
Language
Impairment
Learning
Disability
Developmental
Disability
Gifted Mild
Intellectual
Disability
Multiple
Exceptionalities
Physical
Disability
No
Exceptionality
2018-19 2019-20 2020-21 2021-22
- - - - Disproportionate above 1.0
23
5.0 Mental Health, Well-Being and Engagement
5.1 Persistent Absenteeism
5.1.1 Summary of Outcomes
Needs:
Absenteeism is almost twice as high among some marginalized groups. African, Black, and Afro-Caribbean,
Indigenous, Latinx/Hispanic and Middle Eastern students experience higher instances of absenteeism compared
to other students, suggesting that schools may not be places where they feel safe and/or offer a sense of
belonging due to emotional withdrawal or academic alienation (Hascher & Hagenauer, 2010 and Curry-Stevens
& Kim-Gervey, 2016) especially for marginalized students (see Figure 57).
Gender Diverse students are consistently more likely to be absent compared to those who identify as male or
female. While there has been parity for boys and girls over the last 4 school years, students who identify with a
diverse gender experienced much higher instances of absenteeism, with an important decline in the 2020-21
when schools were primarily online, suggesting that in-person school environments may not be places where
they feel safe and/or a sense of belonging (Pampati et al., 2020) (see Figure 58).
Absenteeism is higher among 2SLGBQA+ students compared to those who identify as heterosexual. Though
absenteeism has remained consistent for students who identify as heterosexual, there have been some
fluctuations for 2SLGBQA+ students, with findings revealing a slight decrease during the period where learning
was almost entirely online, suggesting that they may favour online learning over in-person (see Figure 59).
Socioeconomic vulnerabilities are a significant factor in students’ attendance outcomes. Students
experiencing high socioeconomic vulnerabilities have been absent at a much higher rate consistently over the
years indicating that students who experience these vulnerabilities may not find learning environments
accessible, safe, or conducive to their learning (Van Eck et al., 2017) (see Figure 60).
Students receiving ESL supports are less likely to be absent from school during regular in-person learning. For
students receiving ESL supports, absenteeism appears much lower, though there is a sudden increase during the
2020-21 in-person school closures and shift to online learning, suggesting that they may not have received the
support they needed during this time including lack of digital skills needed for learning from home, and
maintaining adequate home-school communication with learners whose home language is different from the
language of instruction (Gallagher-Mackay, 2021) (see Figure 62).
Emerging Trends:
ELD students are over three times more likely to be absent than non-ELL or ESL students. Students receiving
ELD programming are much more likely to be persistently absent from school. Findings suggest that, in the post-
COVID-19 years, they may have experienced greater challenges, as their rate of persistent absence was much
higher during this time. However, there was a drop in their absences during online learning (2020-21) (see
Figure 62). This may be related to in-person ELD programs being located at central locations rather than at the
student’s local school, meaning that online learning may have been easier to participate in than having to travel
to other, potentially distant, locations.
Students with an IEP are more likely to be persistently absent than students without an IEP. Though
absenteeism has continued to remain much higher among students with an IEP than students without an IEP,
the pandemic may have negatively contributed to their experiences as they have consistently experienced
higher instances of absenteeism, compared to pre-COVID-19, when learning was in-person. In the 2021-22
school year, they continued to be absent much more frequently, suggesting that the limited availability of
support for students with an IEP during remote learning (Rolland, 2020) may have also been a barrier for Peel
students, for whom virtual classes were spaces not conducive to their learning needs. (see Figure 61).

24
Decreases in the disproportionate rates of persistent absenteeism for Latinx/Hispanic and Middle Eastern
students as well as those who identify as 2SLGBQA+ are notable but may be a result of the decreasing
proportion of students with available social identity data from the 2018 student census.
5.1.2 Absenteeism Outcomes
Figure 57 - Students who were Persistently Absent by Indigenous and Racial Background
Figure 58 - Students who were Persistently Absent
by Gender Identity
Figure 59 - Students who were Persistently Absent
by Sexual Orientation
Figure 60 - Students who were Persistently Absent by Socioeconomic Vulnerability Clusters
Figure 61 - Students who were Persistently Absent by IEP Status
Figure 62 - Students who were Persistently Absent by ELL Status
1.7
0.2
1.3
1.9
1.5
0.9
0.7
1.0
1.2
1.1
1.0
2.0
0.2
3.5
2.1
1.5
0.8
0.6
1.2
1.2
1.3
1.0
1.8
0.3
2.0
1.6
1.3
0.8
0.7
1.0
1.2
1.2
1.3
1.9
0.3
2.6
1.6
1.4
0.8
0.6
1.0
1.3
1.2
1.3
African,
Black &
Afro-Caribbean
East
Asian
First Nations,
Métis
and Inuit
Latinx/
Hispanic
Middle
Eastern
South
Asian
Southeast
Asian
White Additional
Racial
Background
Multiple
Racial
Backgrounds
Did not
disclose
2018-19 2019-20 2020-21 2021-22
- - - - Disproportionate above 1.0
2.4
0.9
1.1
1.1
3.4
0.9
1.1
1.1
1.4
0.9
1.1
1.1
2.0
0.9
1.1
1.2
Diverse Gender
Identity
Female Male Did Not Disclose
2018-19 2019-20 2020-21 2021-22
- - - - Disproportionate above 1.0
1.3
1.0
0.6
1.3
1.0
0.6
1.1
1.0
0.8
1.2
1.0
0.8
2SLGBQA+ Heterosexual Did Not Disclose
2018-19 2019-20 2020-21 2021-22
- - - - Disproportionate above 1.0
0.7
0.9
0.9
1.1
1.1
1.6
0.6
0.8
0.9
1.0
1.2
1.9
0.7
0.8
0.9
1.1
1.2
1.7
0.7
0.8
0.9
1.0
1.2
1.9
Low SVI Somewhat Low SVI First Nation,
Métis, Inuit
Somewhat High SVI High SVI Very High SVI
2018-19 2019-20 2020-21 2021-22
- - - - Disproportionate above 1.0
1.6
0.9
2.0
0.9
1.7
0.9
2.1
0.9
IEP No IEP
2018-19 2019-20 2020-21 2021-22
- - - - Disproportionate above 1.0
3.9
0.3
1.3
4.7
0.3
1.4
3.4
1.1
1.0
4.6
0.7
1.1
ELD ESL Not an ELL
2018-19 2019-20 2020-21 2021-22
- - - - Disproportionate above 1.0
25
6.0 Pathways and Transitions
6.1 Special Education Designations
6.1.1 Summary of Outcomes
Needs:
Students that identify as Indigenous, African, Black, and Afro-Caribbean, and white are the most likely to be
identified with an exceptionality. African, Black, and Afro-Caribbean students are about four times more likely
to be identified with a behavioural exceptionality and are one and a half to three times more likely to be
identified with language impairment, learning disability and mild intellectual disability. Indigenous students are
about four to five times more likely to be identified with the following exceptionalities – autism, language
impairment and, learning disability; they are also two times more likely to be identified with a mild intellectual
disability exceptionality. White students are overrepresented in students identified with behavioral and learning
disabilities (see Figure 63-70).
Students identifying as a diverse gender are overrepresented in almost all exceptionalities, but
overrepresentation in behavioural exceptionality has especially increased in recent years. Students who
identify as a diverse gender are approximately two and a half times more likely to be identified with autism and
learning disability exceptionalities. In recent years, these students were approximately four times more likely to
be identified with a behavioural exceptionality compared to 2018-19 where they were one and half times more
likely (see Figure 71-78). This increase may be a result of the relatively smaller group sizes for both diverse
gender identities and those with a behavioural exceptionality.
Overrepresentation of 2SLGBQA+ students. Students that identify as 2SLGBQA+ are overrepresented in
students identified with the following exceptionalities – autism, behavioural, and mild intellectual disability (see
Figure 79-86).
Students experiencing higher socioeconomic vulnerabilities are more likely to be identified with an
exceptionality. Students who experience high socioeconomic vulnerabilities are more likely to be identified with
autism, language impairments and mild intellectual disabilities. They are also much more likely to be identified
with a behavioural exceptionality (approximately three times more likely) compared to students experiencing
less socioeconomic vulnerabilities (see Figure 87-94).
Students who identified as white are more likely to be identified as gifted, suggesting that there may be
assumptions about students’ race which influence how school staff perceive their learning. This trend supports
broader ones that show that teachers tend to favor white students over racialized students in academic
progression and hold stereotypes about racialized groups that limit their academic progress (James & Turner,
2015) (see Figure 65).
East Asian students and students who experience lower socioeconomic vulnerabilities are overrepresented in
students identified with a gifted exceptionality. East Asian students are approximately 6 times more likely to be
identified as gifted and white students are also one and a half times more likely to be identified with a gifted
exceptionality suggesting that there may be assumptions about students’ race which influence how school staff
perceive their learning (Conchas & Perez, 2003, James, 2004; Walton & Truong, 2021). Students who experience
very low socioeconomic vulnerabilities are also two and a half times more likely to be identified as gifted
compared to students who experience higher socioeconomic vulnerabilities suggesting that gifted assessments
privilege those with access to more resources (Parekh, et al., 2018) (see Figure 89).
Gender diverse and 2SLGBQA+ students are also overrepresented in students identified with a gifted
exceptionality (see Figure 73 and Figure 81).
Emerging Trends:
Potential increase in Indigenous, African, Black, and Afro-Caribbean and Latinx/Hispanic students identified with
autism; with a slight decrease in African, Black, and Afro-Caribbean students identified with behavioural
exceptionality and a decrease in Indigenous students identified with language impairment (see Figure 63-70).

26
6.1.1 By Indigenous and Racial Identities
Figure 63 - Students Identified with the Exceptionality Autism by Indigenous and Racial Background
Figure 64 - Students Identified with the Exceptionality Behavioural by Indigenous and Racial Background
Figure 65 - Students Identified with the Exceptionality Gifted by Indigenous and Racial Background
Figure 66 - Students Identified with the Exceptionality Language Impairment by Indigenous and Racial Background
1.1
1.0
4.2
1.2
0.8
0.6
1.4
1.8
1.1
1.1
1.7
1.1
0.9
4.1
1.3
0.8
0.7
1.4
1.8
1.1
1.2
1.6
1.2
1.0
4.3
1.4
0.7
0.7
1.3
1.7
1.1
1.1
1.5
1.3
1.0
4.5
1.6
0.7
0.7
1.3
1.7
1.1
1.2
1.4
African,
Black &
Afro-Caribbean
East
Asian
First Nations,
Métis
and Inuit
Latinx/
Hispanic
Middle
Eastern
South
Asian
Southeast
Asian
White Additional
Racial
Background
Multiple
Racial
Backgrounds
Did not
disclose
2018-19 2019-20 2020-21 2021-22
- - - - Disproportionate above 1.0
3.8
0.2
5.3
0.0
0.1
0.2
0.0
2.3
0.4
1.7
1.8
3.8
0.0
0.0
0.0
0.0
0.1
0.4
2.5
0.5
1.9
1.8
3.5
0.2
0.0
0.0
0.2
0.1
0.0
2.6
0.6
1.9
2.1
3.6
0.0
0.0
0.0
0.3
0.0
0.0
2.3
0.9
2.7
2.5
African,
Black &
Afro-
Caribbean
East
Asian
First Nations,
Métis
and Inuit
Latinx/
Hispanic
Middle
Eastern
South
Asian
Southeast
Asian
White Additional
Racial
Background
Multiple
Racial
Backgrounds
Did not
disclose
2018-19 2019-20 2020-21 2021-22
- - - - Disproportionate above 1.0
0.3
5.9
1.1
0.3
0.4
0.7
0.9
1.6
0.3
1.2
0.4
0.2
5.9
1.1
0.4
0.3
0.7
1.0
1.4
0.3
1.2
0.4
0.2
6.0
1.0
0.4
0.4
0.7
1.1
1.3
0.4
1.3
0.5
0.2
6.0
1.1
0.5
0.4
0.8
1.0
1.2
0.3
1.3
0.5
African,
Black &
Afro-
Caribbean
East
Asian
First Nations,
Métis
and Inuit
Latinx/
Hispanic
Middle
Eastern
South
Asian
Southeast
Asian
White Additional
Racial
Background
Multiple
Racial
Backgrounds
Did not
disclose
2018-19 2019-20 2020-21 2021-22
- - - - Disproportionate above 1.0
2.9
0.2
5.6
1.5
0.8
0.6
0.4
1.0
1.5
1.0
2.2
2.8
0.2
5.7
1.6
0.8
0.6
0.4
0.9
1.3
1.0
2.2
2.8
0.2
5.4
1.9
0.8
0.6
0.5
0.9
1.3
1.0
2.3
2.7
0.2
4.2
1.6
0.9
0.6
0.5
1.0
1.2
1.2
2.2
African,
Black &
Afro-Caribbean
East
Asian
First Nations,
Métis
and Inuit
Latinx/
Hispanic
Middle
Eastern
South
Asian
Southeast
Asian
White Additional
Racial
Background
Multiple
Racial
Backgrounds
Did not
disclose
2018-19 2019-20 2020-21 2021-22
- - - - Disproportionate above 1.0

27
Figure 67 - Students Identified with the Exceptionality Learning Disability by Indigenous and Racial Background
Figure 68 - Students Identified with the Exceptionality Mild Intellectual Disability by Indigenous and Racial Background
Figure 69 - Students with an IEP but not a formal Identification by Indigenous and Racial Background
Figure 70 - Students Receiving Special Education Services without an IEP by Indigenous and Racial Background
1.8
0.4
4.7
1.5
0.5
0.3
0.6
2.9
0.9
1.3
1.8
1.7
0.4
5.4
1.3
0.4
0.3
0.6
2.9
0.8
1.4
1.9
1.8
0.5
5.9
1.4
0.4
0.3
0.6
2.9
0.8
1.4
2.0
1.7
0.4
5.2
1.3
0.5
0.3
0.6
2.9
0.9
1.5
1.9
African,
Black &
Afro-Caribbean
East
Asian
First Nations,
Métis
and Inuit
Latinx/
Hispanic
Middle
Eastern
South
Asian
Southeast
Asian
White Additional
Racial
Background
Multiple
Racial
Backgrounds
Did not
disclose
2018-19 2019-20 2020-21 2021-22
- - - - Disproportionate above 1.0
2.1
0.2
4.7
0.3
1.0
0.8
1.0
0.8
1.7
0.9
2.0
2.1
0.2
3.0
0.3
1.0
0.7
1.0
0.9
1.3
0.9
2.1
2.3
0.3
1.5
0.0
1.0
0.7
1.1
0.9
1.7
1.0
1.8
2.2
0.4
3.3
0.0
1.2
0.7
1.2
0.9
1.8
1.0
1.7
African,
Black &
Afro-Caribbean
East
Asian
First Nations,
Métis
and Inuit
Latinx/
Hispanic
Middle
Eastern
South
Asian
Southeast
Asian
White Additional
Racial
Background
Multiple
Racial
Backgrounds
Did not
disclose
2018-19 2019-20 2020-21 2021-22
- - - - Disproportionate above 1.0
1.6
1.3
2.3
1.0
0.6
0.6
0.7
1.7
0.9
1.4
1.5
1.6
1.3
1.9
1.2
0.6
0.6
0.7
1.7
0.9
1.4
1.4
1.5
1.3
2.0
1.2
0.7
0.6
0.7
1.7
0.9
1.4
1.4
1.6
1.3
1.7
1.3
0.7
0.7
0.7
1.7
0.9
1.3
1.4
African,
Black &
Afro-
Caribbean
East
Asian
First Nations,
Métis
and Inuit
Latinx/
Hispanic
Middle
Eastern
South
Asian
Southeast
Asian
White Additional
Racial
Background
Multiple
Racial
Backgrounds
Did not
disclose
2018-19 2019-20 2020-21 2021-22
- - - - Disproportionate above 1.0
1.7
0.9
1.9
1.5
0.9
0.7
0.7
1.4
1.1
1.3
1.4
1.8
0.9
1.8
1.5
1.0
0.7
0.7
1.4
1.1
1.3
1.3
1.8
0.9
1.7
1.5
1.0
0.7
0.7
1.4
1.2
1.3
1.3
1.8
0.9
1.5
1.7
1.0
0.7
0.8
1.5
1.2
1.3
1.3
African,
Black &
Afro-
Caribbean
East
Asian
First Nations,
Métis
and Inuit
Latinx/
Hispanic
Middle
Eastern
South
Asian
Southeast
Asian
White Additional
Racial
Background
Multiple
Racial
Backgrounds
Did not
disclose
2018-19 2019-20 2020-21 2021-22
- - - - Disproportionate above 1.0

28
6.1.2 By Gender Identity
Figure 71 - Students Identified with the Exceptionality Autism
by Gender Identity
Figure 72 - Students Identified with the Exceptionality Behavioural by
Gender Identity
Figure 73 - Students Identified with the Exceptionality Gifted
by Gender Identity
Figure 74 - Students Identified with the Exceptionality Language
Impairment by Gender Identity
Figure 75 - Students Identified with the Exceptionality Learning
Disability by Gender Identity
Figure 76 - Students Identified with the Exceptionality Mild Intellectual
Disability by Gender Identity
Figure 77 - Students with an IEP but not a formal Identification
by Gender Identity
Figure 78 - Students Receiving Special Education Services without an
IEP by Gender Identity
2.7
0.3
1.6
1.7
2.7
0.3
1.6
1.7
2.4
0.3
1.6
1.7
2.6
0.3
1.6
1.6
Diverse Gender
Identity
Female Male Did Not Disclose
2018-19 2019-20 2020-21 2021-22
- - - - Disproportionate above 1.0
1.5
0.3
1.6
2.4
3.7
0.3
1.5
2.3
4.5
0.3
1.6
2.6
4.0
0.2
1.7
1.6
Diverse Gender
Identity
Female Male Did Not Disclose
2018-19 2019-20 2020-21 2021-22
- - - - Disproportionate above 1.0
2.5
0.7
1.2
1.3
2.1
0.7
1.2
1.0
1.6
0.7
1.2
1.1
1.6
0.7
1.2
1.1
Diverse Gender
Identity
Female Male Did Not Disclose
2018-19 2019-20 2020-21 2021-22
- - - - Disproportionate above 1.0
1.2
0.8
1.2
1.4
1.1
0.8
1.2
1.7
1.5
0.8
1.2
1.8
1.3
0.8
1.2
1.9
Diverse Gender
Identity
Female Male Did Not Disclose
2018-19 2019-20 2020-21 2021-22
- - - - Disproportionate above 1.0
2.2
0.7
1.3
1.6
2.4
0.7
1.3
1.6
2.4
0.7
1.3
1.8
2.5
0.7
1.2
1.8
Diverse Gender
Identity
Female Male Did Not Disclose
2018-19 2019-20 2020-21 2021-22
- - - - Disproportionate above 1.0
1.3
0.7
1.3
1.6
1.4
0.7
1.2
2.1
1.6
0.7
1.3
1.8
1.8
0.7
1.3
2.0
Diverse Gender
Identity
Female Male Did Not Disclose
2018-19 2019-20 2020-21 2021-22
- - - - Disproportionate above 1.0
1.5
0.8
1.2
1.4
1.7
0.8
1.2
1.4
1.7
0.8
1.2
1.4
1.7
0.8
1.2
1.4
Diverse Gender
Identity
Female Male Did Not Disclose
2018-19 2019-20 2020-21 2021-22
- - - - Disproportionate above 1.0
2.2
0.9
1.1
1.2
2.2
0.9
1.1
1.2
2.1
0.9
1.1
1.2
2.2
0.9
1.1
1.2
Diverse Gender
Identity
Female Male Did Not Disclose
2018-19 2019-20 2020-21 2021-22
- - - - Disproportionate above 1.0

29
6.1.3 Sexual Orientation
Figure 79 - Students Identified with the Exceptionality Autism
by Sexual Orientation
Figure 80 - Students Identified with the Exceptionality Behavioural
by Sexual Orientation
Figure 81 - Students Identified with the Exceptionality Gifted
by Sexual Orientation
Figure 82 - Students Identified with the Exceptionality Language
Impairment by Sexual Orientation
Figure 83 - Students Identified with the Exceptionality Learning
Disability by Sexual Orientation
Figure 84 - Students Identified with the Exceptionality Mild Intellectual
Disability by Sexual Orientation
Figure 85 - Students with an IEP but not a formal Identification
by Sexual Orientation
Figure 86 - Students Receiving Special Education Services without an IEP
by Sexual Orientation
1.5
0.6
3.0
1.6
0.6
2.8
1.7
0.6
2.7
2.0
0.6
2.3
2SLGBQA+ Heterosexual/Straight Did Not Disclose
2018-19 2019-20 2020-21 2021-22
- - - - Disproportionate above 1.0
2.0
0.9
1.2
2.5
0.8
1.3
2.8
0.8
1.0
2.0
0.9
1.0
2SLGBQA+ Heterosexual/Straight Did Not Disclose
2018-19 2019-20 2020-21 2021-22
- - - - Disproportionate above 1.0
1.9
1.0
0.7
2.0
1.0
0.7
1.9
1.0
0.7
1.9
1.0
0.7
2SLGBQA+ Heterosexual/Straight Did Not Disclose
2018-19 2019-20 2020-21 2021-22
- - - - Disproportionate above 1.0
1.0
0.9
1.7
1.0
0.9
1.7
1.0
0.9
1.8
0.9
0.8
1.7
2SLGBQA+ Heterosexual/Straight Did Not Disclose
2018-19 2019-20 2020-21 2021-22
- - - - Disproportionate above 1.0
1.3
1.0
1.1
1.3
0.9
1.2
1.3
0.9
1.3
1.4
0.9
1.3
2SLGBQA+ Heterosexual/Straight Did Not Disclose
2018-19 2019-20 2020-21 2021-22
- - - - Disproportionate above 1.0
1.8
0.6
3.0
1.9
0.6
3.0
2.0
0.6
2.9
2.2
0.6
2.5
2SLGBQA+ Heterosexual/Straight Did Not Disclose
2018-19 2019-20 2020-21 2021-22
- - - - Disproportionate above 1.0
1.2
0.9
1.4
1.2
0.9
1.3
1.4
0.9
1.2
1.3
1.0
1.1
2SLGBQA+ Heterosexual/Straight Did Not Disclose
2018-19 2019-20 2020-21 2021-22
- - - - Disproportionate above 1.0
1.9
0.9
0.8
1.9
0.9
0.8
2.0
1.0
0.8
2.0
1.0
0.7
2SLGBQA+ Heterosexual/Straight Did Not Disclose
2018-19 2019-20 2020-21 2021-22
- - - - Disproportionate above 1.0

30
6.1.4 Socioeconomic Vulnerability Clusters
Figure 87 - Students Identified with the Exceptionality Autism by Socioeconomic Vulnerability Cluster
Figure 88 - Students Identified with the Exceptionality Behavioural by Socioeconomic Vulnerability Cluster
Figure 89 - Students Identified with the Exceptionality Gifted by Socioeconomic Vulnerability Cluster
Figure 90 - Students Identified with the Exceptionality Language Impairment by Socioeconomic Vulnerability Cluster
0.9
1.0
0.9
1.0
1.1
1.3
0.9
1.0
0.9
1.0
1.1
1.3
0.9
1.0
0.8
1.0
1.2
1.4
0.9
1.0
0.9
1.0
1.1
1.4
Low SVI Somewhat Low SVI Moderate SVI Somewhat High SVI High SVI Very High SVI
2018-19 2019-20 2020-21 2021-22
- - - - Disproportionate above 1.0
0.8
0.7
0.6
1.0
1.4
2.3
0.8
0.7
0.5
1.1
1.1
2.8
0.9
0.6
0.5
1.2
1.1
2.8
0.8
0.6
0.4
1.2
1.2
3.0
Low SVI Somewhat Low SVI Moderate SVI Somewhat High SVI High SVI Very High SVI
2018-19 2019-20 2020-21 2021-22
- - - - Disproportionate above 1.0
2.5
1.2
0.7
0.5
0.6
0.2
2.5
1.2
0.7
0.5
0.6
0.3
2.5
1.2
0.7
0.5
0.5
0.3
2.5
1.1
0.7
0.5
0.5
0.3
Low SVI Somewhat Low SVI Moderate SVI Somewhat High SVI High SVI Very High SVI
2018-19 2019-20 2020-21 2021-22
- - - - Disproportionate above 1.0
0.6
0.9
1.0
1.0
1.1
1.6
0.7
0.9
1.1
0.9
1.1
1.6
0.7
0.9
1.0
1.0
1.1
1.6
0.7
0.9
1.0
1.0
1.1
1.7
Low SVI Somewhat Low SVI Moderate SVI Somewhat High SVI High SVI Very High SVI
2018-19 2019-20 2020-21 2021-22
- - - - Disproportionate above 1.0

31
Figure 91 - Students Identified with the Exceptionality Learning Disability by Socioeconomic Vulnerability Cluster
Figure 92 - Students Identified with the Exceptionality Mild Intellectual Disability by Socioeconomic Vulnerability Cluster
Figure 93 - Students with an IEP but not a formal Identification by Socioeconomic Vulnerability Cluster
Figure 94 - Students Receiving Special Education Services without an IEP by Socioeconomic Vulnerability Cluster
1.1
1.0
0.9
1.0
1.1
1.2
1.1
1.0
0.8
1.0
1.1
1.2
1.1
1.0
0.8
0.9
1.1
1.2
1.1
1.0
0.8
0.9
1.1
1.3
Low SVI Somewhat Low SVI Moderate SVI Somewhat High SVI High SVI Very High SVI
2018-19 2019-20 2020-21 2021-22
- - - - Disproportionate above 1.0
0.7
0.8
1.0
0.9
1.2
1.6
0.7
0.8
1.0
1.0
1.2
1.8
0.8
0.7
1.0
1.0
1.2
1.6
0.8
0.7
1.1
1.1
1.1
1.6
Low SVI Somewhat Low SVI Moderate SVI Somewhat High SVI High SVI Very High SVI
2018-19 2019-20 2020-21 2021-22
- - - - Disproportionate above 1.0
1.1
0.9
0.9
0.9
1.1
1.3
1.1
0.9
0.9
0.9
1.1
1.3
1.1
0.9
0.9
0.9
1.1
1.3
1.1
0.9
0.9
0.9
1.1
1.3
Low SVI Somewhat Low SVI Moderate SVI Somewhat High SVI High SVI Very High SVI
2018-19 2019-20 2020-21 2021-22
- - - - Disproportionate above 1.0
0.9
0.9
0.9
1.0
1.2
1.4
0.9
0.9
0.9
1.0
1.1
1.4
0.9
0.9
0.9
1.0
1.2
1.4
1.0
0.9
0.9
1.0
1.1
1.4
Low SVI Somewhat Low SVI Moderate SVI Somewhat High SVI High SVI Very High SVI
2018-19 2019-20 2020-21 2021-22
- - - - Disproportionate above 1.0
32
6.2 Academic and University Pathways
The Disproportionality Index has been calculated based on the exclusion of students from Academic/de-streamed
pathways. As Peel District School Board moves to eliminating Applied pathways from Grade 9 and 10 courses, the
numbers of students not in Academic pathways can be quite small. Using this approach produces clearer outcomes that
describe the disproportionate experiences for specific groups of students.
6.2.1 Summary of Outcomes
Needs:
With the discontinuation of Applied programming in Grade 9, a higher proportion of students are accessing
the Academic (de-streamed) stream which can lead to university level courses. However, reviewing the
outcomes, we see that some groups are still disproportionately streamed out of this opportunity (see Figure 95-
118).
African, Black, and Afro-Caribbean, Indigenous, and Latinx/Hispanic students are much more likely to not
access Academic English. African, Black, and Afro-Caribbean students were over two times less likely to be
enrolled in Academic English. Even when Grade 9 Applied English, was discontinued in 2021-22, their rate of
exclusion continues to remain high (see Figure 95).
African, Black, and Afro-Caribbean, Indigenous and Latinx/Hispanic students, along with those who did not
disclose their race, are much more likely to be in a non-university-bound track pathway. In both grades 11 and
12, African, Black, and Afro-Caribbean, Indigenous, and Latinx/Hispanic students and those who did not disclose
a race are much more likely to be in a non-University track pathway. This trend suggests that progression to
higher education may be much lower among these groups revealing the persisting impact of racism and
discrimination in the educational system (Doran et al., 2015) (see Figure 119-120).
Some marginalized groups are underrepresented in University pathways in grade 12. African, Black, and Afro-
Caribbean students, along with Indigenous and Latin American students, those who experience very high and
high socioeconomic vulnerabilities, and students with Diverse Gender Identities, are disproportionately
underrepresented in University track pathways compared to others. This aligns with larger social trends as these
groups are often also under-represented in Ontario’s post-secondary education (Doran et al., 2015) (see Figure
120, Figure 123, and Figure 126).
Girls are more likely to pursue Academic English and Academic Mathematics compared to other genders.
Students who did not disclose their gender, along with gender diverse and male students are less likely to
pursue Academic English or Math (where the gap is slightly less) in Grade 9 and Grade 10. These trends point to
the presence of ongoing barriers to learning, especially for gender diverse students (see Figure 97-98 Figure 109-
110).
Girls are also more likely to pursue University track pathway compared to boys or gender diverse students.
Findings also reveal that, while female enrollment in a university track pathway has increased over the last few
school years, the disproportional gap has increased for gender diverse students and those who did not disclose
their gender. For male students, the proportion of students in non-Academic and non-University pathways has
remained consistently high. Likewise, COVID-19 closures appear to have further exacerbated challenges for
gender diverse students and those who did not disclose a gender, pointing to the presence of ongoing barriers
to their educational progression. Girls’ progress, notably in Grade 12, has remained the same during the
pandemic with lower representation in non-University pathways (Figure 121 and Figure 123).
There are no differences in representation by sexual orientation in Grade 9 Academic English though
heterosexual/straight student enrollment is slightly higher in Grade 10 Academic English compared to others
(Figure 99-100). A similar pattern is evident for Grade 9 and 10 Academic Mathematics (see Figure 111-112).
For University track pathway, barriers are evident for 2SLGBQA+ students, and those who did not disclose their
sexual orientation, across Grade 11 and 12, suggesting the presence of ongoing discrimination in learning
pursuits and school experiences (see
Figure 122 and Figure 124).
Students experiencing high socioeconomic vulnerabilities are much more likely to be excluded from Academic
English (Figure 101-102) and Math (Figure 113-114), across grades, and also much less likely to pursue a

33
university track pathway. Findings consistently reveal that students of low socioeconomic vulnerabilities (SVI)
are much more likely to pursue advanced learning compared to those from higher SVI backgrounds. These
findings suggest that classism-related barriers likely have an impact on students’ progression towards post-
secondary education.
Students with an IEP are about two times less likely to take academic or de-streamed classes. Likewise,
students with an IEP are about two times less likely to be enrolled in university track pathway, revealing the
presence of significant barriers to their academic progression (See Figure 103-104, Figure 115-116 and Figure
127-128).
ELL students are underrepresented in academic or de-streamed classes. Students receiving support as English
language learners are less likely to be enrolled in pathways towards post-secondary education which raises
further concerns not only about the availability of resources and support, but also about the potential impact of
such limitations on their future academic and employment pursuits.
Emerging Trends:
Students experiencing higher socioeconomic vulnerabilities may have increased barriers with the de-streaming
of Math.
Students identifying as 2SLGBQA+ were overrepresented in those not taking Grade 10 Academic English and
Math with the disproportionality increasing over time in Academic English.
The gap in access for students receiving ELL support appears to be improving as the university track pathway gap
is less for grade 12 ELL students compared to Grade 11, suggesting that students may be catching up between
the two school years.
Access to university track pathways for students with diverse gender identities may also be increasing.
6.2.2 Grades 9 and 10 English
Figure 95 - Students Not in Grade 9 Academic English by Indigenous and Racial Background
Figure 96 - Students Not in Grade 10 Academic English by Indigenous and Racial Background
2.1
0.3
2.5
1.9
1.0
0.6
0.7
1.4
1.0
1.7
2.2
2.1
0.3
N/R
1.6
0.7
0.5
0.8
1.6
1.2
1.9
2.2
2.3
0.2
5.4
2.1
0.7
0.5
0.6
1.5
1.1
1.4
2.2
1.9
0.2
10.1
2.3
1.3
0.5
0.7
1.2
1.0
2.0
2.3
African,
Black &
Afro-
Caribbean
East
Asian
First Nations,
Métis &
Inuit
Latinx/
Hispanic
Middle
Eastern
South
Asian
Southeast
Asian
White Multiple
Racial
Backgrounds
Additional
Racial
Background
Did not
disclose
2018-19 2019-20 2020-21 2021-22
- - - - Disproportionate above 1.0
2.3
0.4
2.9
1.6
0.8
0.5
0.7
1.5
0.9
1.2
2.5
2.3
0.2
2.5
2.3
0.8
0.5
0.9
1.4
1.1
1.7
2.3
2.1
0.2
N/R
1.2
0.7
0.4
1.0
1.9
1.1
1.7
2.4
2.6
0.1
5.5
2.7
0.7
0.4
0.6
1.5
1.3
1.2
2.4
African,
Black &
Afro-
Caribbean
East
Asian
First Nations,
Métis &
Inuit
Latinx/
Hispanic
Middle
Eastern
South
Asian
Southeast
Asian
White Multiple
Racial
Backgrounds
Additional
Racial
Background
Did not
disclose
2018-19 2019-20 2020-21 2021-22
- - - - Disproportionate above 1.0
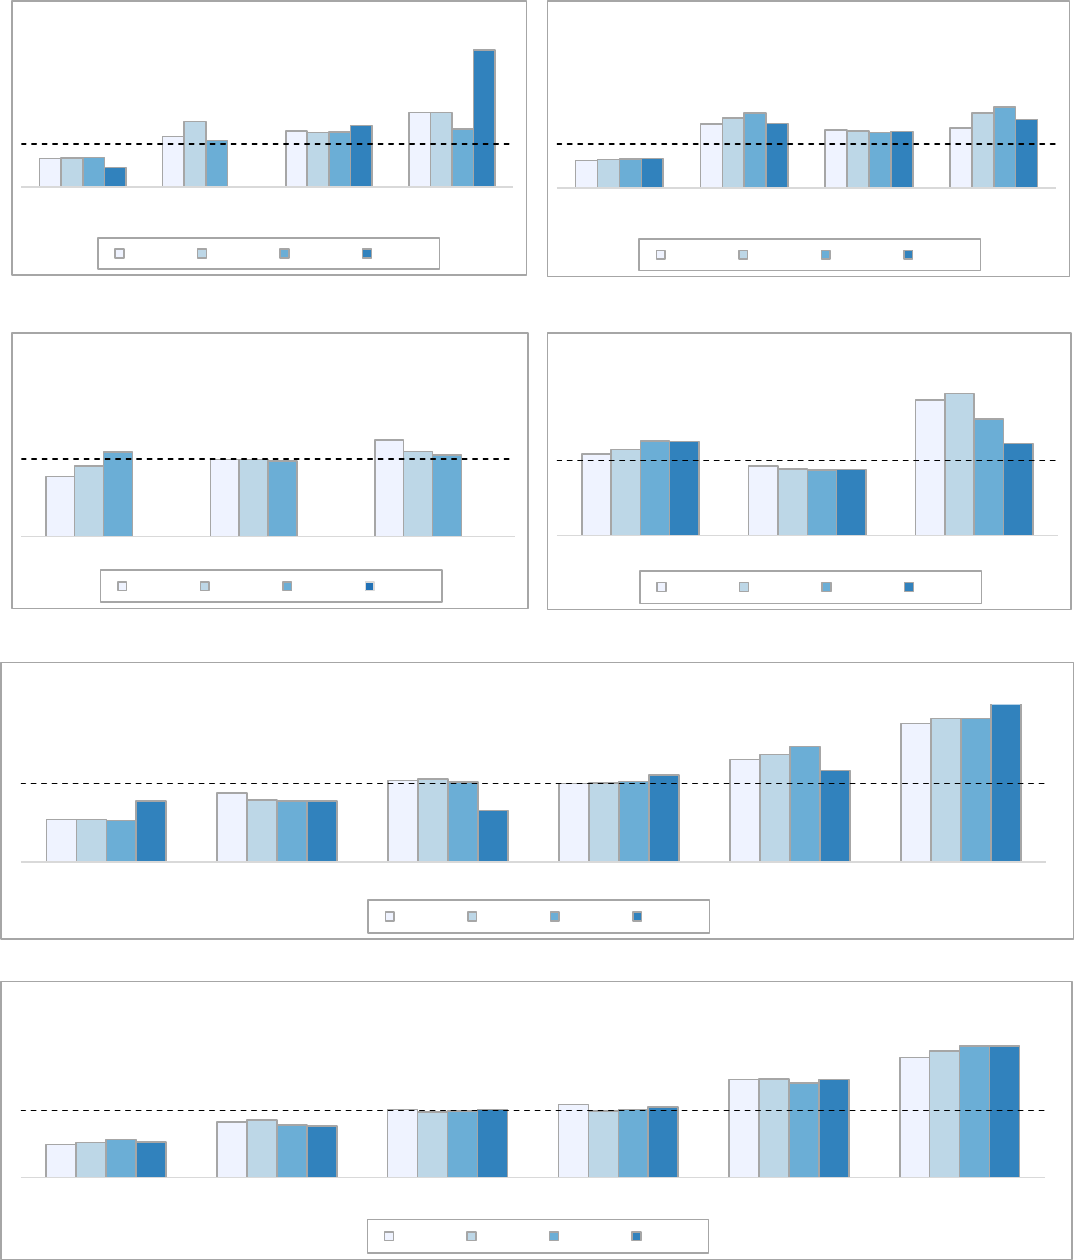
34
Figure 97 - Students Not in Grade 9 Academic English
by Gender Identity
Figure 98 - Students Not in Grade 10 Academic English
by Gender Identity
Figure 99 - Students Not in Grade 9 Academic English
by Sexual Orientation
* Sexual orientation of Grade 9 students in 2021-22 is not available.
Figure 100 - Students Not in Grade 10 Academic English
by Sexual Orientation
Figure 101 - Students Not in Grade 9 Academic English by Socioeconomic Vulnerability Cluster
Figure 102 - Students Not in Grade 10 Academic English by Socioeconomic Vulnerability Cluster
0.7
1.2
1.3
1.7
0.7
1.5
1.3
1.7
0.7
1.1
1.3
1.3
0.5
0.0
1.4
3.2
Female Diverse gender
Identity
Male Did not disclose
2018-19 2019-20 2020-21 2021-22
- - - - Disproportionate above 1.0
0.6
1.5
1.3
1.4
0.6
1.6
1.3
1.7
0.7
1.7
1.3
1.8
0.7
1.5
1.3
1.6
Female Diverse Gender
Identity
Male Did not disclose
2018-19 2019-20 2020-21 2021-22
- - - - Disproportionate above 1.0
0.8
1.0
1.2
0.9
1.0
1.1
1.1
1.0
1.1
N\A*
N\A
N\A
2SLGBQA+ Heterosexual/Straight Did not disclose
2018-19 2019-20 2020-21 2021-22
- - - - Disproportionate above 1.0
1.1
0.9
1.8
1.1
0.9
1.9
1.3
0.9
1.5
1.3
0.9
1.2
2SLGBQA+ Heterosexual/Straight Did not disclose
2018-19 2019-20 2020-21 2021-22
- - - - Disproportionate above 1.0
0.5
0.9
1.0
1.0
1.3
1.8
0.5
0.8
1.1
1.0
1.4
1.8
0.5
0.8
1.0
1.0
1.5
1.8
0.8
0.8
0.7
1.1
1.2
2.6
Low Somewhat Low Moderate Somewhat High High Very High
2018-19 2019-20 2020-21 2021-22
- - - - Disproportionate above 1.0
0.5
0.8
1.0
1.1
1.5
1.8
0.5
0.9
1.0
1.0
1.5
1.9
0.6
0.8
1.0
1.0
1.4
2.0
0.5
0.8
1.0
1.1
1.5
2.0
Low Somewhat Low Moderate Somewhat High High Very High
2018-19 2019-20 2020-21 2021-22
- - - - Disproportionate above 1.0

35
Figure 103 - Students Not in Grade 9 Academic English by Students
with an IEP Status
Figure 104 - Students Not in Grade 10 Academic English by Students
with an IEP Status
Figure 105 - Students Not in Grade 9 Academic English by ELL Status
Figure 106 - Students Not in Grade 10 Academic ELL Status
5.2.3 Grades 9 and 10 Academic/De-streamed Mathematics
Figure 107 - Students Not in Grade 9 Academic/De-streamed Math by Indigenous and Racial Background
Figure 108 - Students Not in Grade 10 Academic Mathematics by Indigenous and Racial Background
4.2
0.5
4.3
0.5
4.2
0.5
7.0
0.1
IEP No IEP
2018-19 2019-20 2020-21 2021-22
- - - - Disproportionate above 1.0
4.3
0.5
4.3
0.5
4.5
0.5
4.3
0.5
IEP No IEP
2018-19 2019-20 2020-21 2021-22
- - - - Disproportionate above 1.0
1.9
1.0
2.4
1.0
1.9
1.0
1.5
1.0
ELL Not ELL
2018-19 2019-20 2020-21 2021-22
- - - - Disproportionate above 1.0
1.4
1.0
1.9
1.0
1.7
1.0
1.4
1.0
ELL Not ELL
2018-19 2019-20 2020-21 2021-22
- - - - Disproportionate above 1.0
2.3
0.2
2.2
2.3
1.1
0.5
0.8
1.3
1.1
1.8
1.9
2.2
0.3
N/R
1.7
1.0
0.5
0.9
1.6
1.2
1.5
2.1
2.4
0.2
4.3
2.4
0.9
0.5
0.7
1.5
1.3
1.3
2.1
1.9
0.1
7.0
1.5
1.3
0.5
0.4
1.3
1.4
2.2
2.2
African,
Black &
Afro-
Caribbean
East
Asian
First Nations,
Métis &
Inuit
Latinx/
Hispanic
Middle
Eastern
South
Asian
Southeast
Asian
White Multiple
Racial
Backgrounds
Additional
Racial
Background
Did not
disclose
2018-19 2019-20 2020-21 2021-22
- - - - Disproportionate above 1.0
2.2
0.3
2.3
1.9
0.8
0.6
0.9
1.4
1.1
1.1
1.9
2.2
0.3
1.7
2.3
1.1
0.6
0.9
1.3
1.1
1.8
1.8
2.1
0.3
N/R
1.8
0.9
0.5
1.1
1.6
1.2
1.5
2.0
2.4
0.2
3.9
2.4
0.8
0.5
0.8
1.5
1.4
1.4
2.0
African,
Black &
Afro-
Caribbean
East
Asian
First Nations,
Métis &
Inuit
Latinx/
Hispanic
Middle
Eastern
South
Asian
Southeast
Asian
White Multiple
Racial
Backgrounds
Additional
Racial
Background
Did not
disclose
2018-19 2019-20 2020-21 2021-22
- - - - Disproportionate above 1.0

36
Figure 109 - Students Not in Grade 9 Academic Mathematics
by Gender Identity
Figure 110 - Students Not in Grade 10 Academic Mathematics
by Gender Identity
Figure 111 - Students Not in Grade 9 Academic Mathematics
by Sexual Orientation
* Sexual orientation of Grade 9 students in 2021-22 is not available.
Figure 112 - Students Not in Grade 10 Academic Mathematics
by Sexual Orientation
Figure 113 - Students Not in Grade 9 Academic Mathematics by Socioeconomic Vulnerabilities
Figure 114 - Students Not in Grade 10 Academic Mathematics by Socioeconomic Vulnerabilities
0.8
1.5
1.1
1.6
0.9
1.8
1.1
1.7
0.8
1.2
1.1
1.8
0.6
1.4
1.3
3.2
Female Diverse gender
Identity
Male Did not disclose
2018-19 2019-20 2020-21 2021-22
- - - - Disproportionate above 1.0
0.9
1.8
1.1
1.3
0.9
1.7
1.1
1.4
0.9
1.4
1.1
1.4
0.9
1.4
1.1
1.7
Female Diverse Gender
Identity
Male Did not disclose
2018-19 2019-20 2020-21 2021-22
- - - - Disproportionate above 1.0
0.9
1.0
1.2
1.0
1.0
1.0
1.0
1.0
1.0
N\A*
N\A
N\A
2SLGBQA+ Heterosexual/Straight Did not disclose
2018-19 2019-20 2020-21 2021-22
- - - - Disproportionate above 1.0
1.4
0.9
1.6
1.3
0.9
1.6
1.3
0.9
1.3
1.2
0.9
1.1
2SLGBQA+ Heterosexual/Straight Did not disclose
2018-19 2019-20 2020-21 2021-22
- - - - Disproportionate above 1.0
0.5
0.9
1.0
1.1
1.3
1.8
0.6
0.8
1.0
1.1
1.4
1.8
0.5
0.8
1.0
1.1
1.4
1.8
0.7
0.7
0.8
1.1
1.2
2.4
Low Somewhat Low Moderate Somewhat High High Very High
2018-19 2019-20 2020-21 2021-22
- - - - Disproportionate above 1.0
0.5
0.9
1.0
1.2
1.3
1.6
0.5
0.8
1.0
1.1
1.3
1.7
0.6
0.8
1.1
1.1
1.3
1.7
0.6
0.8
1.1
1.1
1.4
1.8
Low Somewhat Low Moderate Somewhat High High Very High
2018-19 2019-20 2020-21 2021-22
- - - - Disproportionate above 1.0

37
Figure 115 - Students Not in Grade 9 Academic Mathematics by
Students with an IEP
Figure 116 - Students Not in Grade 10 Academic Mathematics by
Students with an IEP
Figure 117 - Students Not in Grade 9 Academic Mathematics by ELL
Status
Figure 118 - Students Not in Grade 10 Academic Mathematics by ELL
Status
5.2.4 Grade 11 and 12 University Pathway
Figure 119 - Grade 11 Students Not in a University Track Pathway by Indigenous and Racial Identities
Figure 120 - Grade 12 Students Not in a University Track Pathway by Indigenous and Racial Identities
3.4
0.7
3.5
0.7
3.6
0.6
5.8
0.3
IEP No IEP
2018-19 2019-20 2020-21 2021-22
- - - - Disproportionate above 1.0
3.0
0.7
3.0
0.7
3.2
0.7
3.2
0.7
IEP No IEP
2018-19 2019-20 2020-21 2021-22
- - - - Disproportionate above 1.0
2.1
0.9
2.3
0.9
2.3
0.9
3.4
0.9
ELL Not ELL
2018-19 2019-20 2020-21 2021-22
- - - - Disproportionate above 1.0
1.6
1.0
1.8
0.9
1.9
1.0
1.9
1.0
ELL Not ELL
2018-19 2019-20 2020-21 2021-22
- - - - Disproportionate above 1.0
2.0
0.4
1.5
1.0
0.5
1.1
1.4
1.5
1.1
2.0
2.2
0.3
2.0
1.8
1.1
0.5
0.9
1.4
1.1
0.9
2.3
2.1
0.3
1.6
2.1
1.1
0.5
1.0
1.4
1.7
1.1
2.0
2.0
0.3
4.3
1.5
0.9
0.5
1.2
1.7
1.4
1.3
2.1
African,
Black &
Afro-
Caribbean
East
Asian
First Nations,
Métis
and Inuit
Latinx/
Hispanic
Middle
Eastern
South
Asian
Southeast
Asian
White Additional
Racial
Background
Multiple
Racial
Backgrounds
Did not
disclose
2018-19 2019-20 2020-21 2021-22
N/R
- - - - Disproportionate above 1.0
2.1
0.4
1.7
0.9
0.6
1.2
1.3
1.4
1.1
1.6
2.1
0.3
4.1
1.6
1.0
0.5
1.0
1.4
1.4
1.2
1.9
2.2
0.4
2.8
1.9
1.1
0.5
1.0
1.3
1.2
1.0
2.1
2.0
0.3
1.5
2.2
1.1
0.6
1.0
1.4
1.6
1.0
2.0
African,
Black &
Afro-Caribbean
East
Asian
First Nations,
Métis
and Inuit
Latinx/
Hispanic
Middle
Eastern
South
Asian
Southeast
Asian
White Additional
Racial
Background
Multiple
Racial
Backgrounds
Did not
disclose
2018-19 2019-20 2020-21 2021-22
N/R
- - - - Disproportionate above 1.0
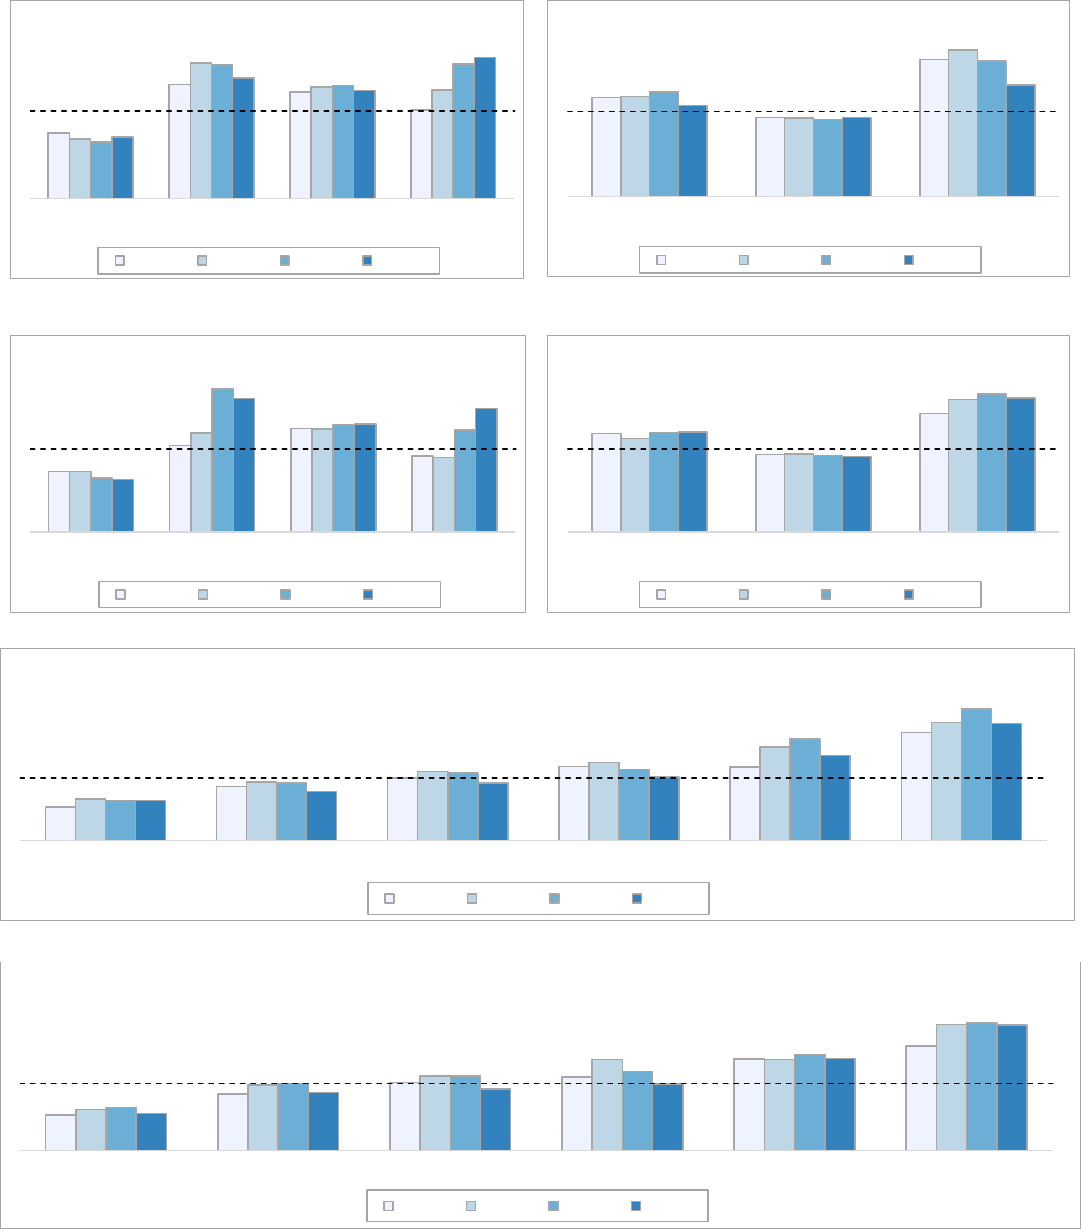
38
Figure 121 - Grade 11 Students Not in a University Track Pathway
by Gender Identity
Figure 122 - Grade 11 Students Not in a University Track Pathway
by Sexual Orientation
Figure 123 - Grade 12 Students Not in a University Track Pathway
by Gender Identity
Figure 124 - Grade 12 Students Not in a University Track Pathway
by Sexual Orientation
Figure 125 - Grade 11 Students Not in a University Track Pathway by Socioeconomic Vulnerability Cluster
Figure 126 - Grade 12 Students Not in a University Track Pathway by Socioeconomic Vulnerability Cluster
0.8
1.3
1.2
1.0
0.7
1.5
1.3
1.2
0.6
1.5
1.3
1.5
0.7
1.4
1.2
1.6
Female Diverse Gender
Identity
Male Did not disclose
2018-19 2019-20 2020-21 2021-22
- - - - Disproportionate above 1.0
1.2
0.9
1.6
1.2
0.9
1.7
1.2
0.9
1.6
1.1
0.9
1.3
2SLGBQA+ Heterosexual/Straight Did not disclose
2018-19 2019-20 2020-21 2021-22
- - - - Disproportionate above 1.0
0.7
1.0
1.3
0.9
0.7
1.2
1.2
0.9
0.7
1.7
1.3
1.2
0.6
1.6
1.3
1.5
Female Diverse Gender
Identity
Male Did not disclose
2018-19 2019-20 2020-21 2021-22
- - - - Disproportionate above 1.0
1.2
0.9
1.4
1.1
0.9
1.6
1.2
0.9
1.7
1.2
0.9
1.6
2SLGBQA+ Heterosexual/Straight Did not disclose
2018-19 2019-20 2020-21 2021-22
- - - - Disproportionate above 1.0
0.5
0.9
1.0
1.2
1.2
1.7
0.7
0.9
1.1
1.2
1.5
1.9
0.6
0.9
1.1
1.1
1.6
2.1
0.6
0.8
0.9
1.0
1.4
1.9
Low Somewhat Low Moderate Somewhat High High Very High
2018-19 2019-20 2020-21 2021-22
- - - - Disproportionate above 1.0
0.5
0.8
1.0
1.1
1.4
1.6
0.6
1.0
1.1
1.4
1.4
1.9
0.6
1.0
1.1
1.2
1.4
1.9
0.6
0.9
0.9
1.0
1.4
1.9
Low Somewhat Low Moderate Somewhat High High Very High
2018-19 2019-20 2020-21 2021-22
- - - - Disproportionate above 1.0
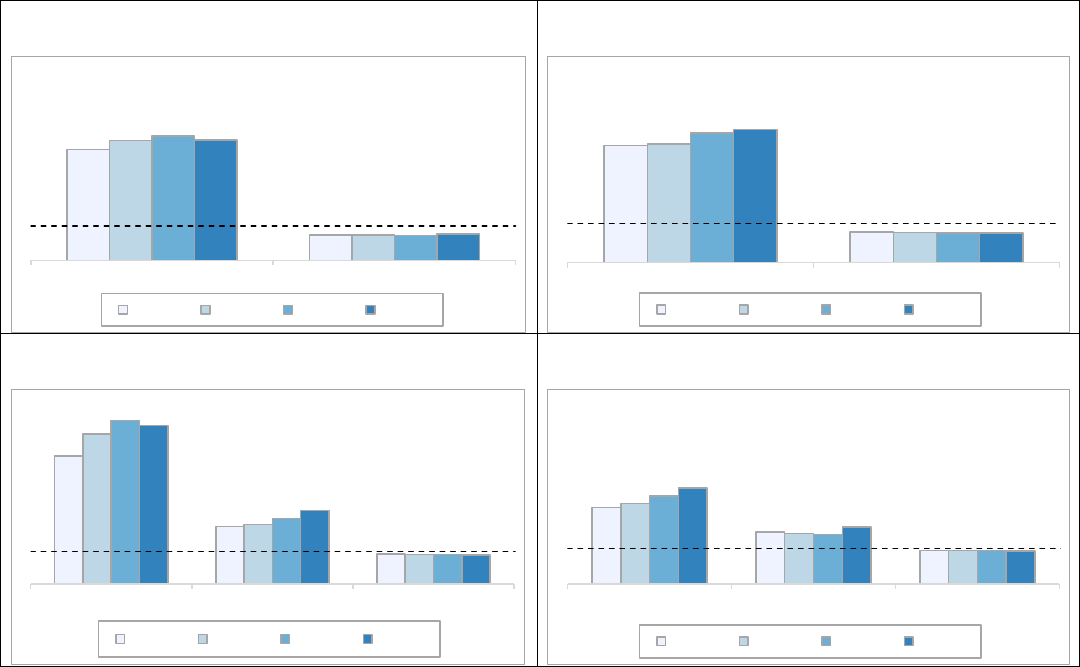
39
Figure 127 - Grade 11 Students Not in a University Track Pathway
by IEP Status
Figure 128 - Grade 12 Students Not in a University Track Pathway
by IEP Status
Figure 129 - Grade 11 Students Not in a University Track Pathway
by ELL Status
Figure 130 - Grade 12 Students Not in a University Track Pathway
by ELL Status
6.3 Regional Learning Choice Programs
RLCPs are specialty education programs offered at many locations across Peel DSB that empower students by providing
an opportunity to develop and explore skills in a particular area of interest. While educational programs that focus on
the students’ strengths and interests are invaluable to supporting their growth and development, access to these
programs needs to be fair and equitable so that these opportunities are not limited to select groups. Analyses of similar
programs in the neighbouring Toronto District School Board have shown that students in specialized programs were less
likely to represent minoritized identities including Black and Indigenous populations and more likely to be from families
with a higher socioeconomic status (SES) (Gaztambide-Fernández & Parekh, 2017).
The charts below show the representation of student identities in (a) any RLCP, (b) Advanced Placement (AP) courses, (c)
Arts related programs, (d) Business programs, (e) the International Baccalaureate program, (f) the Sci-Tech program, (g)
Sports-related programs, and (h) Technology-focused programs. Some identities are over-represented in one program
(Disproportionality Index greater than 1.0), meaning they’re more likely than others to be enrolled in it. The same
identity group may be underrepresented in another program (index below 1.0) showing they’re less likely to be enrolled
in that one. This perfectly demonstrates the varying effects that prejudice, and different stereotypes can have on the
same group of students.
6.3.1 Summary of Outcomes
Needs:
African, Black, and Afro-Caribbean, Indigenous, Latinx/Hispanic, Middle Eastern, and Southeast Asian
students are underrepresented in RLCP. African, Black, and Afro-Caribbean students are severely
underrepresented in AP, IB, Business, Science and Technology programs. However, African, Black, and Afro-
Caribbean students are overrepresented in sports programs which may stem from the harmful stereotype that
associate African, Black, and Afro-Caribbean children and youth with physical prowess and superior athletic
3.2
0.7
3.5
0.7
3.6
0.7
3.5
0.8
IEP No IEP
2018-19 2019-20 2020-21 2021-22
- - - - Disproportionate above 1.0
3.0
0.8
3.0
0.8
3.3
0.7
3.4
0.7
IEP No IEP
2018-19 2019-20 2020-21 2021-22
- - - - Disproportionate above 1.0
3.9
1.8
0.9
4.6
1.8
0.9
5.0
2.0
0.9
4.8
2.2
0.9
ELD ESL Not an ELL
2018-19 2019-20 2020-21 2021-22
- - - - Disproportionate above 1.0
2.2
1.5
0.9
2.3
1.4
0.9
2.5
1.4
1.0
2.7
1.6
0.9
ELD ESL Not an ELL
2018-19 2019-20 2020-21 2021-22
- - - - Disproportionate above 1.0
40
abilities further eroding their access to academic success (James & Turner, 2017). Indigenous students are also
severely underrepresented in all programs with the exception of the Arts and AP programs. (See Figure 131-138)
Persistent disproportionate gender outcomes in RLCPs. Girls are overrepresented in AP, IB and the Arts
compared to boys who are overrepresented in technology programs. Students who identify with a diverse
gender identity are underrepresented in AP, IB, Science, Technology and sports programs (See Figure 139-146).
Students who identify as 2SLGBA+ more likely to be in RLCPs. 2SLGBQA+ students are well represented in
RLCPs and are particularly overrepresented in Arts programs (Figure 147-154). They are, however,
underrepresented in Sports programs likely related to the well documented exclusion of 2SLGBTQIA+ students
and adults from organized sports (Egale Canada 2020, for example).
Students who experience low socioeconomic vulnerabilities are more likely to be enrolled in Regional
Learning Choice Programs compared to students who experience high to very high socioeconomic
vulnerabilities. This is especially evident in the AP program where students who experience very high
socioeconomic vulnerabilities are three times less likely to be in the AP program (Figure 155-162). The
correlation between this measure of socioeconomic status and participation in RLCPs cannot be further
examined with available data, however, it is potentially due to the financial investment needed to apply for
these programs as well as required annual enrolment fees (though financial support is available for students
who require it). Transportation is also likely a barrier to accessing these programs as bussing is not available for
students outside of the area normally serviced by a program’s hosting school.
Representation of students with Special Education Needs and English Language Learners are not presented.
Analysis of representation in RLCPs by students’ special education status and English language learner status did
not yield any useful findings and were not included in this report. Students with Special Education Needs
(excluding giftedness) and ELLs were underrepresented in all programs likely related to the restricted timelines
to enter an RLCP, the enhanced nature of the programs, and/or a gap in knowledge about the existence of these
programs.
Emerging Trends:
Despite, the boards’ self-identification process for regional learning choice programs that began in the 2020-
2021 school year to address disproportionalities, there continues to be disproportionate involvement for
African, Black, and Afro-Caribbean and Indigenous students. Unfortunately, the change in admissions process
will likely take several years to be fully visible in these charts as the nature of RLCPs having one-time entry will
mean that past inequities in admissions will persist in enrolment numbers. However, there is a slight increase in
African, Black, and Afro-Caribbean students participating in the Arts programs.
The Increased proportion of students identifying as a diverse gender identity in Sports-related RLCPs (Figure
145) is an interesting trend that runs contrary to recognized trends in society at large (Egale Canada 2020, for
example). These results may be due to the relatively small sample size but will warrant further observation
when new student census data is available.
Increased number of students experiencing very high socioeconomic vulnerabilities participating in technology
programs over recent years (See Figure 162).

41
6.3.2 Indigenous and Racial Identities
Figure 131 - Students Disproportionate Representation in Any Regional Learning Choice Program by Indigenous and Racial Identities
Figure 132 - Students Disproportionate Representation in the Advanced Placement Program by Indigenous and Racial Identities
Figure 133 - Students Disproportionate Representation in the Arts Program by Indigenous and Racial Identities
Figure 134 - Students Disproportionate Representation in the Business Program by Indigenous and Racial Identities
Figure 135 - Students Disproportionate Representation in the International Baccalaureate® Program by Indigenous and Racial Identities
0.4
1.8
0.3
0.6
0.4
1.2
0.8
1.1
0.8
1.0
0.4
0.5
1.9
0.3
0.7
0.4
1.2
0.8
1.1
0.7
1.0
0.4
0.5
1.8
0.4
0.7
0.5
1.2
0.8
1.0
0.6
1.0
0.4
0.6
1.8
0.3
0.6
0.5
1.2
0.9
1.0
0.5
1.0
0.5
African,
Black &
Afro-Caribbean
East
Asian
First Nations,
Métis
and Inuit
Latinx/
Hispanic
Middle
Eastern
South
Asian
Southeast
Asian
White Additional
Racial
Background
Multiple
Racial
Backgrounds
Did not
disclose
2018-19 2019-20 2020-21 2021-22
- - - - Over-represented above 1.0
0.2
4.4
1.1
0.1
0.5
1.4
0.7
0.2
0.2
0.6
0.2
0.2
4.1
1.0
0.1
0.5
1.4
0.7
0.2
0.1
0.5
0.2
0.2
4.3
1.0
0.2
0.4
1.4
0.6
0.2
0.0
0.5
0.2
0.2
3.6
0.0
0.0
0.4
1.5
0.5
0.1
0.1
0.5
0.2
African,
Black &
Afro-Caribbean
East
Asian
First Nations,
Métis
and Inuit
Latinx/
Hispanic
Middle
Eastern
South
Asian
Southeast
Asian
White Additional
Racial
Background
Multiple
Racial
Backgrounds
Did not
disclose
2018-19 2019-20 2020-21 2021-22
- - - - Over-represented above 1.0
0.8
1.7
1.2
1.6
0.2
0.4
1.3
2.6
0.9
1.9
0.6
0.9
1.8
1.1
1.9
0.3
0.5
1.3
2.5
0.9
1.9
0.5
1.0
1.8
1.1
1.8
0.4
0.5
1.3
2.5
0.8
1.8
0.6
1.1
1.7
0.9
1.6
0.3
0.6
1.3
2.3
0.7
1.8
0.7
African,
Black &
Afro-Caribbean
East
Asian
First Nations,
Métis
and Inuit
Latinx/
Hispanic
Middle
Eastern
South
Asian
Southeast
Asian
White Additional
Racial
Background
Multiple
Racial
Backgrounds
Did not
disclose
2018-19 2019-20 2020-21 2021-22
- - - - Over-represented above 1.0
0.2
1.1
0.0
0.1
0.5
1.6
0.6
0.5
0.8
0.8
0.4
0.2
1.0
0.0
0.1
0.5
1.6
0.6
0.5
0.7
0.8
0.4
0.2
0.9
0.0
0.1
0.5
1.5
0.7
0.5
0.5
0.9
0.4
0.3
1.1
0.0
0.2
0.6
1.5
1.0
0.4
0.3
0.8
0.5
African,
Black &
Afro-Caribbean
East
Asian
First Nations,
Métis
and Inuit
Latinx/
Hispanic
Middle
Eastern
South
Asian
Southeast
Asian
White Additional
Racial
Background
Multiple
Racial
Backgrounds
Did not
disclose
2018-19 2019-20 2020-21 2021-22
- - - - Over-represented above 1.0
0.2
2.5
0.0
0.1
0.4
1.6
0.8
0.2
0.8
0.5
0.4
0.1
2.9
0.0
0.0
0.5
1.5
0.7
0.2
0.5
0.5
0.3
0.1
2.7
0.3
0.1
0.6
1.5
0.8
0.3
0.3
0.6
0.3
0.2
2.7
0.3
0.2
0.6
1.5
0.7
0.3
0.2
0.7
0.3
African,
Black &
Afro-Caribbean
East
Asian
First Nations,
Métis
and Inuit
Latinx/
Hispanic
Middle
Eastern
South
Asian
Southeast
Asian
White Additional
Racial
Background
Multiple
Racial
Backgrounds
Did not
disclose
2018-19 2019-20 2020-21 2021-22
- - - - Over-represented above 1.0

42
Figure 136 - Students Disproportionate Representation in the Science / Technology Program by Indigenous and Racial Identities
Figure 137 - Students Disproportionate Representation in the Sports Program by Indigenous and Racial Identities
Figure 138 - Students Disproportionate Representation in the Technology Program by Indigenous and Racial Identities
0.2
1.2
0.0
0.2
0.4
1.6
0.5
0.6
0.7
0.4
0.4
0.2
1.4
0.0
0.3
0.4
1.5
0.6
0.6
0.6
0.4
0.5
0.1
1.5
0.0
0.2
0.4
1.5
0.6
0.6
0.7
0.6
0.4
0.2
1.5
0.0
0.5
0.4
1.4
0.9
0.6
0.3
0.7
0.5
African,
Black &
Afro-Caribbean
East
Asian
First Nations,
Métis
and Inuit
Latinx/
Hispanic
Middle
Eastern
South
Asian
Southeast
Asian
White Additional
Racial
Background
Multiple
Racial
Backgrounds
Did not
disclose
2018-19 2019-20 2020-21 2021-22
- - - - Over-represented above 1.0
1.3
0.4
0.0
1.1
0.4
0.9
0.6
1.8
0.9
1.2
0.7
1.3
0.3
0.0
1.7
0.3
0.9
0.6
1.9
0.7
1.3
0.5
1.3
0.2
0.0
1.4
0.4
1.0
0.3
1.5
1.1
1.1
0.6
1.5
0.4
0.0
1.0
0.5
0.8
0.5
1.8
1.1
1.2
0.8
African,
Black &
Afro-Caribbean
East
Asian
First Nations,
Métis
and Inuit
Latinx/
Hispanic
Middle
Eastern
South
Asian
Southeast
Asian
White Additional
Racial
Background
Multiple
Racial
Backgrounds
Did not
disclose
2018-19 2019-20 2020-21 2021-22
- - - - Over-represented above 1.0
0.9
0.1
0.0
0.6
0.3
1.5
0.2
0.6
1.3
0.6
0.8
0.9
0.2
0.0
0.6
0.2
1.4
0.2
0.6
1.5
0.8
0.7
0.7
0.3
1.5
0.0
0.2
1.5
0.3
0.6
1.4
0.8
0.6
0.9
0.2
1.8
0.0
0.5
1.3
0.6
0.7
1.7
0.8
0.8
African,
Black &
Afro-Caribbean
East
Asian
First Nations,
Métis
and Inuit
Latinx/
Hispanic
Middle
Eastern
South
Asian
Southeast
Asian
White Additional
Racial
Background
Multiple
Racial
Backgrounds
Did not
disclose
2018-19 2019-20 2020-21 2021-22
- - - - Over-represented above 1.0

43
7.3.2 By Gender Identity
Figure 139 – Students’ Disproportionate Representation in Any
Regional Learning Choice Program by Gender Identity
Figure 140 – Students’ Disproportionate Representation in the Advanced
Placement Program by Gender Identity
Figure 141 – Students’ Disproportionate Representation in the Arts
Program by Gender Identity
Figure 142 – Students’ Disproportionate Representation in the Business
Program by Gender Identity
Figure 143 – Students’ Disproportionate Representation in the
International Baccalaureate® Program by Gender Identity
Figure 144 – Students’ Disproportionate Representation in the Science /
Technology Program by Gender Identity
Figure 145 – Students’ Disproportionate Representation in the Sports
Program by Gender Identity
Figure 146 – Students’ Disproportionate Representation in the
Technology Program by Gender Identity
1.3
1.2
0.9
0.9
1.1
1.2
0.9
0.8
1.1
1.1
0.9
0.7
1.0
1.2
0.9
0.7
Diverse Gender
Identity
Female Male Did not disclose
2018-19 2019-20 2020-21 2021-22
- - - - Over-represented above 1.0
0.0
1.2
0.8
0.6
0.3
1.2
0.8
0.7
0.4
1.2
0.8
0.7
0.5
1.3
0.8
0.5
Diverse Gender
Identity
Female Male Did not disclose
2018-19 2019-20 2020-21 2021-22
- - - - Over-represented above 1.0
2.8
1.6
0.5
1.0
2.6
1.6
0.5
0.8
2.6
1.6
0.4
0.6
2.3
1.6
0.4
0.8
Diverse Gender
Identity
Female Male Did not disclose
2018-19 2019-20 2020-21 2021-22
- - - - Over-represented above 1.0
1.1
0.9
1.0
1.0
0.9
0.9
1.1
0.9
1.0
1.0
1.1
0.7
1.0
1.0
1.1
0.7
Diverse Gender
Identity
Female Male Did not disclose
2018-19 2019-20 2020-21 2021-22
- - - - Over-represented above 1.0
0.7
1.2
0.8
0.6
0.3
1.1
0.9
0.6
0.5
1.1
0.9
0.6
0.2
1.2
0.9
0.6
Diverse Gender
Identity
Female Male Did not disclose
2018-19 2019-20 2020-21 2021-22
- - - - Over-represented above 1.0
1.2
0.9
1.1
0.9
0.9
0.9
1.1
0.9
0.1
0.9
1.1
0.7
0.1
0.9
1.1
0.7
Diverse Gender
Identity
Female Male Did not disclose
2018-19 2019-20 2020-21 2021-22
- - - - Over-represented above 1.0
0.4
1.0
1.0
1.0
0.5
0.9
1.1
0.7
0.7
0.9
1.1
0.8
1.0
0.9
1.1
1.3
Diverse Gender
Identity
Female Male Did not disclose
2018-19 2019-20 2020-21 2021-22
- - - - Over-represented above 1.0
0.6
0.6
1.3
1.3
0.0
0.7
1.3
1.4
0.3
0.7
1.3
1.3
0.5
0.6
1.3
1.4
Diverse Gender
Identity
Female Male Did not disclose
2018-19 2019-20 2020-21 2021-22
- - - - Over-represented above 1.0

44
7.3.3 By Sexual Orientation
Figure 147 – Students’ Disproportionate Representation in Any
Regional Learning Choice Program by Sexual Orientation
Figure 148 - Students’ Disproportionate Representation in the Advanced
Placement Program by Sexual Orientation
Figure 149 - Students’ Disproportionate Representation in the Arts
Program by Sexual Orientation
Figure 150 - Students’ Disproportionate Representation in the Business
Program by Sexual Orientation
Figure 151 - Students’ Disproportionate Representation in the
International Baccalaureate® Program by Sexual Orientation
Figure 152 - Students’ Disproportionate Representation in the Science /
Technology Program by Sexual Orientation
Figure 153 - Students’ Disproportionate Representation in the Sports
Program by Sexual Orientation
Figure 154 - Students’ Disproportionate Representation in the
Technology Program by Sexual Orientation
1.3
1.0
0.6
1.3
1.0
0.7
1.2
1.0
0.9
1.3
1.0
0.9
2SLGBQA+ Heterosexual/Straight Did not disclose
2018-19 2019-20 2020-21 2021-22
- - - - Over-represented above 1.0
1.1
1.0
0.7
1.1
1.0
0.6
1.2
1.0
0.7
1.1
1.0
0.8
2SLGBQA+ Heterosexual/Straight Did not disclose
2018-19 2019-20 2020-21 2021-22
- - - - Over-represented above 1.0
2.3
0.9
0.5
2.4
0.9
0.6
2.3
0.9
0.7
2.3
0.9
0.7
2SLGBQA+ Heterosexual/Straight Did not disclose
2018-19 2019-20 2020-21 2021-22
- - - - Over-represented above 1.0
0.9
1.0
0.8
0.9
1.0
0.9
0.7
1.0
1.1
0.7
1.0
1.1
2SLGBQA+ Heterosexual/Straight Did not disclose
2018-19 2019-20 2020-21 2021-22
- - - - Over-represented above 1.0
1.0
1.1
0.6
0.8
1.1
0.6
0.9
1.0
0.8
0.9
1.0
0.8
2SLGBQA+ Heterosexual/Straight Did not disclose
2018-19 2019-20 2020-21 2021-22
- - - - Over-represented above 1.0
0.9
1.1
0.7
0.8
1.1
0.7
0.9
1.0
1.0
1.0
1.0
1.0
2SLGBQA+ Heterosexual/Straight Did not disclose
2018-19 2019-20 2020-21 2021-22
- - - - Over-represented above 1.0
0.6
1.1
0.9
0.6
1.0
1.0
0.6
1.0
1.0
0.6
1.0
1.2
2SLGBQA+ Heterosexual/Straight Did not disclose
2018-19 2019-20 2020-21 2021-22
- - - - Over-represented above 1.0
0.7
1.0
1.2
0.8
1.0
1.4
0.6
0.9
1.6
0.7
0.8
1.9
2SLGBQA+ Heterosexual/Straight Did not disclose
2018-19 2019-20 2020-21 2021-22
- - - - Over-represented above 1.0

45
7.3.4 by Socioeconomic Vulnerability Clusters
Figure 155 - Students’ Disproportionate Representation in Any Regional Learning Choice Program by Socioeconomic Vulnerability Cluster
Figure 156 - Students’ Disproportionate Representation in the Advanced Placement Program by Socioeconomic Vulnerability Cluster
Figure 157 - Students’ Disproportionate Representation in the Arts Program by Socioeconomic Vulnerability Cluster
Figure 158 -Students’ Disproportionate Representation in the Business Program by Socioeconomic Vulnerability Cluster
1.2
1.1
1.0
1.0
0.8
0.6
1.2
1.1
1.0
0.9
0.8
0.6
1.2
1.1
1.1
0.9
0.9
0.6
1.2
1.1
1.1
0.9
0.9
0.6
Low SVI Somewhat LowS VI Moderate SVI Somewhat High SVI High SVI Very High SVI
2018-19 2019-20 2020-21 2021-22
- - - - Over-represented above 1.0
1.6
1.2
1.0
0.9
0.6
0.3
1.7
1.1
1.1
0.7
0.6
0.3
1.7
1.2
1.0
0.5
0.7
0.3
1.6
1.1
1.1
0.6
0.8
0.4
Low SVI Somewhat LowS VI Moderate SVI Somewhat High SVI High SVI Very High SVI
2018-19 2019-20 2020-21 2021-22
- - - - Over-represented above 1.0
1.3
1.1
0.9
1.0
0.9
0.7
1.3
1.0
0.8
1.0
1.1
0.7
1.3
1.0
0.9
1.0
1.2
0.6
1.3
1.1
0.9
0.9
1.1
0.6
Low SVI Somewhat LowS VI Moderate SVI Somewhat High SVI High SVI Very High SVI
2018-19 2019-20 2020-21 2021-22
- - - - Over-represented above 1.0
1.1
1.1
1.1
0.9
0.8
0.6
1.1
1.2
1.0
1.0
0.8
0.6
1.2
1.2
1.0
0.9
0.7
0.6
1.1
1.1
1.1
0.9
0.9
0.6
Low SVI Somewhat LowS VI Moderate SVI Somewhat High SVI High SVI Very High SVI
2018-19 2019-20 2020-21 2021-22
- - - - Over-represented above 1.0

46
Figure 159 -Students’ Disproportionate Representation in the International Baccalaureate® Program by Socioeconomic Vulnerability Cluster
Figure 160 -Students’ Disproportionate Representation in the Science / Technology Program by Socioeconomic Vulnerability Cluster
Figure 161 - Students’ Disproportionate Representation in the Sports Program by Socioeconomic Vulnerability Cluster
Figure 162 - Students’ Disproportionate Representation in the Technology Program by Socioeconomic Vulnerability Cluster
1.2
1.2
1.0
0.9
0.8
0.6
1.2
1.2
1.0
0.9
0.8
0.6
1.2
1.2
0.9
0.9
0.8
0.7
1.2
1.3
0.9
0.9
0.8
0.5
Low SVI Somewhat LowS VI Moderate SVI Somewhat High SVI High SVI Very High SVI
2018-19 2019-20 2020-21 2021-22
- - - - Over-represented above 1.0
1.1
1.2
1.1
0.8
0.8
0.6
1.1
1.1
1.1
0.9
0.8
0.6
1.1
1.1
1.1
0.9
0.9
0.6
1.1
1.0
1.2
0.9
0.9
0.6
Low SVI Somewhat LowS VI Moderate SVI Somewhat High SVI High SVI Very High SVI
2018-19 2019-20 2020-21 2021-22
- - - - Over-represented above 1.0
0.7
1.0
1.3
1.3
0.7
0.6
0.8
1.0
1.3
1.2
0.6
0.6
0.7
1.0
1.4
1.3
0.6
0.5
0.8
1.1
1.3
1.2
0.8
0.6
Low SVI Somewhat LowS VI Moderate SVI Somewhat High SVI High SVI Very High SVI
2018-19 2019-20 2020-21 2021-22
- - - - Over-represented above 1.0
0.2
1.1
1.6
1.5
0.8
0.3
0.2
1.1
1.6
1.2
1.1
0.4
0.2
1.1
1.7
1.2
1.1
0.4
0.2
0.9
1.6
1.2
1.3
0.7
Low SVI Somewhat LowS VI Moderate SVI Somewhat High SVI High SVI Very High SVI
2018-19 2019-20 2020-21 2021-22
- - - - Over-represented above 1.0

47
6.4 French Instruction
6.4.1 Summary of Outcomes
Needs:
Representation in French Immersion by social identity has been stable over the last four years with only
Indigenous students being consistently under-represented to a large extent (Figure 163).
Representation in Extended French has shown more variation due to the smaller total number of students
included. Only students indicating Southeast Asian descent (Figure 164) and those indicating a diverse gender
identity (Figure 166) have been well-underrepresented consistently over the four years.
Students who experience low socioeconomic vulnerabilities are more highly represented in the French
Immersion program compared to students who experience high to very high socioeconomic vulnerabilities
(Figure 169).
Emerging Trends:
An increasing proportion of students accessing Extended French in PDSB indicated Middle Eastern and Latin
American racial identities.
6.4.2 French Outcomes
Figure 163 - Students’ Disproportionate Representation in French Immersion by Indigenous and Racial Background
Figure 164 - Students’ Disproportionate Representation in Extended French by Indigenous and Racial Background
1.3
1.6
0.2
1.4
1.0
0.7
1.0
1.3
1.0
1.4
1.0
1.3
1.7
0.1
1.5
1.0
0.8
1.1
1.2
1.0
1.4
1.0
1.3
1.6
0.1
1.5
1.1
0.8
1.1
1.2
1.1
1.4
1.0
1.3
1.6
0.2
1.5
1.2
0.8
1.2
1.2
1.0
1.3
0.9
African,
Black &
Afro-
Caribbean
East
Asian
First Nation,
Métis
and Inuit
Latinx/
Hispanic
Middle
Eastern
South
Asian
Southeast
Asian
White Additional
Racial
Background
Multiple
Racial
Backgrounds
Did not
disclose
2018-19 2019-20 2020-21 2021-22
- - - - Over-represented above 1.0
0.8
0.7
0.7
2.1
2.3
0.8
0.8
1.2
1.1
1.0
0.9
0.8
0.6
0.7
3.1
2.8
0.8
0.6
1.2
1.1
1.0
0.7
0.8
0.6
0.0
2.7
3.1
0.8
0.5
1.2
1.3
0.9
0.8
0.8
0.7
0.7
2.5
3.2
0.8
0.4
1.1
1.0
1.2
0.8
African,
Black &
Afro-Caribbean
East
Asian
First Nation,
Métis
and Inuit
Latinx/
Hispanic
Middle
Eastern
South
Asian
Southeast
Asian
White Additional
Racial
Background
Multiple
Racial
Backgrounds
Did not
disclose
2018-19 2019-20 2020-21 2021-22
- - - - Over-represented above 1.0
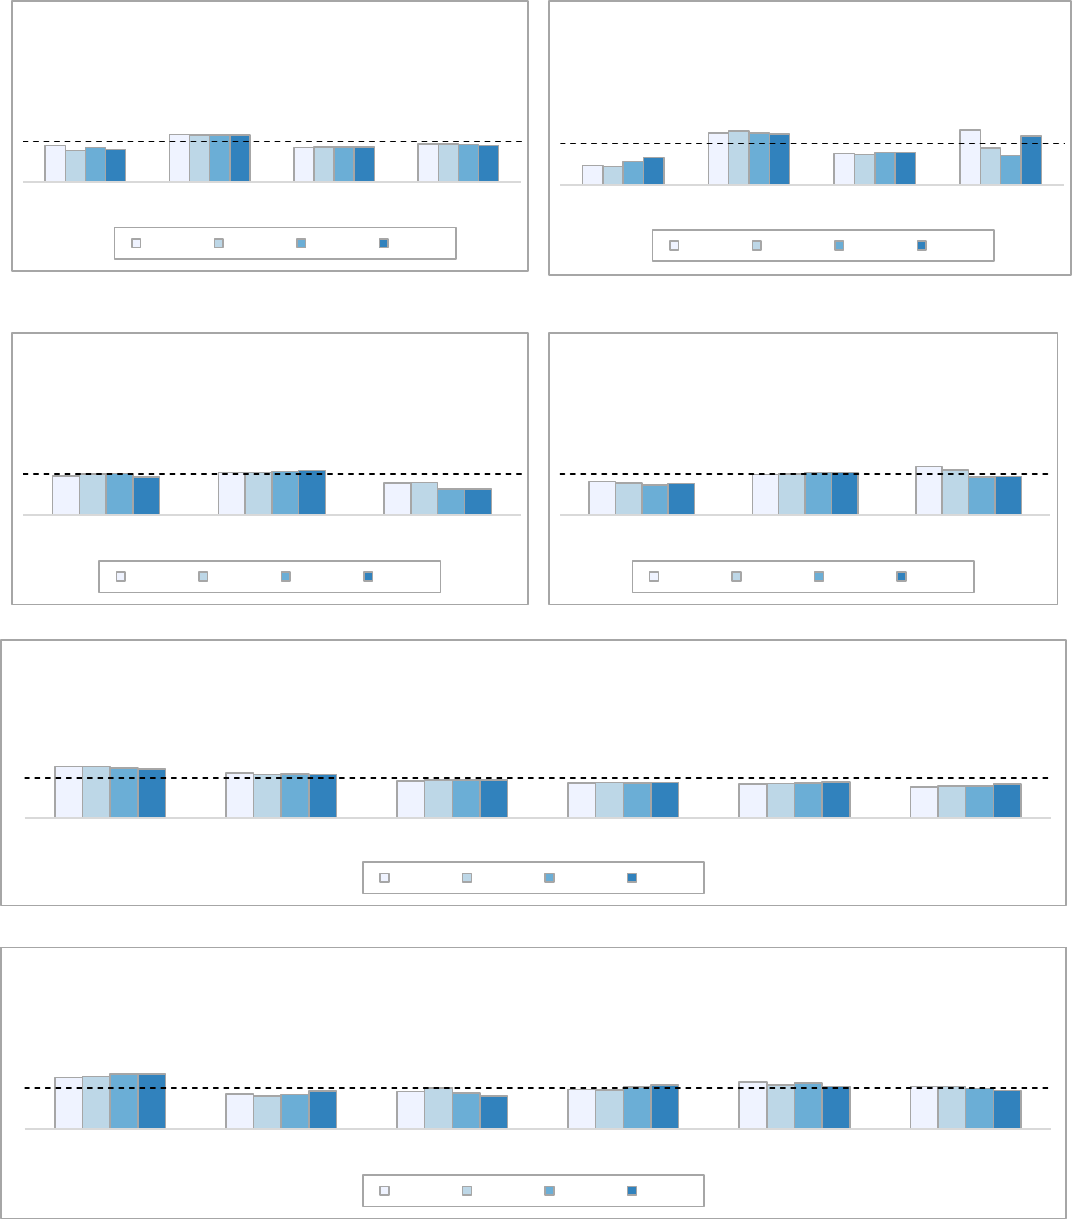
48
Figure 165 - Students’ Disproportionate Representation in French
Immersion by Gender Identity
Figure 166 - Students’ Disproportionate Representation in Extended
French by Gender Identity
Figure 167 - Students’ Disproportionate Representation in French
Immersion by Sexual Orientation
Figure 168 - Students’ Disproportionate Representation in Extended
French by Sexual Orientation
Figure 169 - Students’ Disproportionate Representation in French Immersion by Socioeconomic Vulnerability Cluster
Figure 170 - Students’ Disproportionate Representation in Extended French by Socioeconomic Vulnerability Cluster
0.9
1.2
0.9
0.9
0.8
1.2
0.9
0.9
0.9
1.2
0.9
0.9
0.8
1.2
0.9
0.9
Diverse Gender
Identity
Female Male Did Not Disclose
2018-19 2019-20 2020-21 2021-22
- - - - Over-represented above 1.0
0.5
1.3
0.8
1.3
0.4
1.3
0.7
0.9
0.6
1.3
0.8
0.7
0.7
1.2
0.8
1.2
Diverse Gender
Identity
Female Male Did Not Disclose
2018-19 2019-20 2020-21 2021-22
- - - - Over-represented above 1.0
1.0
1.0
0.8
1.0
1.0
0.8
1.0
1.1
0.6
0.9
1.1
0.6
2SLGBQA+ Heterosexual/Straight Did Not Disclose
2018-19 2019-20 2020-21 2021-22
- - - - Over-represented above 1.0
0.8
1.0
1.2
0.8
1.0
1.1
0.7
1.0
0.9
0.8
1.0
0.9
2SLGBQA+ Heterosexual/Straight Did Not Disclose
2018-19 2019-20 2020-21 2021-22
- - - - Over-represented above 1.0
1.3
1.1
0.9
0.9
0.9
0.8
1.3
1.1
0.9
0.9
0.9
0.8
1.3
1.1
0.9
0.9
0.9
0.8
1.2
1.1
0.9
0.9
0.9
0.8
LowSVI SomewhatLowSVI ModerateSVI SomewhatHighSVI HighSVI VeryHighSVI
2018-19 2019-20 2020-21 2021-22
- - - - Over-represented above 1.0
1.3
0.9
0.9
1.0
1.1
1.0
1.3
0.8
1.0
1.0
1.1
1.0
1.3
0.8
0.9
1.0
1.1
1.0
1.4
0.9
0.8
1.1
1.0
0.9
LowSVI SomewhatLowSVI ModerateSVI SomewhatHighSVI HighSVI VeryHighSVI
2018-19 2019-20 2020-21 2021-22
- - - - Over-represented above 1.0

49
References
Adamu, M. and Hogan, L. (2015). Point of entry: The preschool-to prison pipeline. Center for American Progress. Retrieved from
https://cdn.americanprogress.org/wpcontent/uploads/2015/10/08000111/PointOfEntryreportUPDATE.pdf
Artiles, A. J., Harry, B., Reschly, D. J., & Chinn, P. C. (2002). Over-identification of students of color in special education: A critical overview.
Multicultural perspectives, 4(1), 3-10.
Booth, D., Elliott-Johns, S., & Bruce, F. (2009). Boys’ literacy attainment: Research and related practice. A report prepared for the Ontario Ministry
of Education. Retrieved from
http://www.edugains.ca/resourcesLIT/BoysLiteracy/BoysLiteracyDVD/5Supports/1_Boys'LiteracyTeacherInquiryK-
12/LiteratureReview/Boys_Literacy_Attainment.pdf
Broer M., Bai Y. and Fonseca F. (2019) A Review of the Literature on Socioeconomic Status and Educational Achievement. In: Socioeconomic
Inequality and Educational Outcomes (pp 7-17). IEA Research for Education (A Series of In-depth Analyses Based on Data of the
International Association for the Evaluation of Educational Achievement (IEA)), vol 5. Springer, Cham.
https://link.springer.com/content/pdf/10.1007/978-3-030-11991-1_2.pdf
Brym, R. (2019). Antisemitic and anti-Israel actions and attitudes in Canada and internationally: A research agenda. Patterns of Prejudice, 53(4),
407-420.
Buchmann, C. (2002). Measuring family background in international studies of education: Conceptual issues and methodological challenges. In
National Research Council (Ed.), Methodological advances in cross-national surveys of educational achievement (pp. 150–197).
Washington, DC: The National Academies Press. Retrieved from https://doi.org/10.17226/10322
Chadha, E., Herbert, S., & Richard, S. (2020). Review of the Peel District School Board. Ontario Ministry of Education. Retrieved from
http://www.edu.gov.on.ca/eng/new/review-peel-districtschool-board-report-en.pdf
Cholewa, B., Hull, M. F., Babcock, C. R. and Smith, A. D. (2018). Predictors and academic outcomes associated with in-school suspension. School
Psychology Quarterly, 33(2), 191.
Chu, E.M. and Ready, D.D. (2018). Exclusion and urban public health schools: short- and long-term consequences of school suspensions. American
Journal of Education, 124(4), 479-509. https://doi.org/10.1086/698454
Coles, J.A., & Powell, T. (2020). A BlackCrit analysis on Black urban youth and suspension disproportionality as anti-Black symbolic violence. Race
Ethnicity & Education, 23(1), 113-133. https://doi.org/10.1080/13613324.2019.1631778
Conchas, G.Q., & Perez, C.C. (2003). Surfing the “model minority” wave of success: how the school context shapes distinct experiences among
Vietnamese youth. New Directions for Youth Development, 100, 41-56.
Currie-Patterson, N., & Watson, K. (2017). A policy, a ‘priority’, an unfinished project: The Ontario First Nation, Métis, and Inuit education policy
framework. Canadian Journal for New Scholars in Education, 8(1), 70-79.
Currie, M.T.S., Ng-A-Fook, N., & Drake, A.S. (2021). Is CRRP enough? Addressing antiracism(s) in teacher education. Journal of the American
Association for the Advancement of Curriculum Studies, 14(2), 1-28
Curry-Stevens, A., Kim-Gervey, C., & Chief Education Office Research Team. (2016). Chronic absenteeism report.
De Valenzuela, J. S., Copeland, S. R., Qi, C. H., & Park, M. (2006). Examining educational equity: Revisiting the disproportionate representation of
minority students in special education. Exceptional children, 72(4), 425-441.
Doran, J., Ferguson, A. K., Khan, G., Ryu, G., Naimool, D., Hanson, M. D., & Childs, R. A. (2015). What are Ontario’s Universities Doing to Improve
Access for Under-represented Groups? Toronto: Higher Education Quality Council of Ontario. Retrieved from:
https://heqco.ca/pub/what-are-ontarios-universities-doing-to-improve-access-for-under-represented-groups/
Egale Canada (2020). Sports inclusion in Canada: Literature review. Retrieved from: https://egale.ca/awareness/sports-inclusion/.
Finigan-Carr, N.M. (2017). Linking health and education for African American students’ success. Boca Raton, FL: CRC Press.
Friedman, C. and Leaper. C. (2010). Sexual-minority college women’s experiences with discrimination: Relations with identity and collective action.
Psychology of Women Quarterly, 34.
Gallagher-Mackay, K., et al. (2021). COVID-19 and education disruption in Ontario: Emerging evidence on impacts. Ontario COVID-19 Science
Advisory Table. Retrieved from: https://covid19-sciencetable.ca/sciencebrief/covid-19-and-education-disruption-in-ontario-emerging-
evidence-on-impacts/
Gaztambide-Fernández, R., & Parekh, G. (2017). Market “choices” or structured pathways? How specialized arts education contributes to the
reproduction of inequality. Education Policy Analysis Archives, 25(41). http://dx.doi.org/10.14507/epaa.25.2716
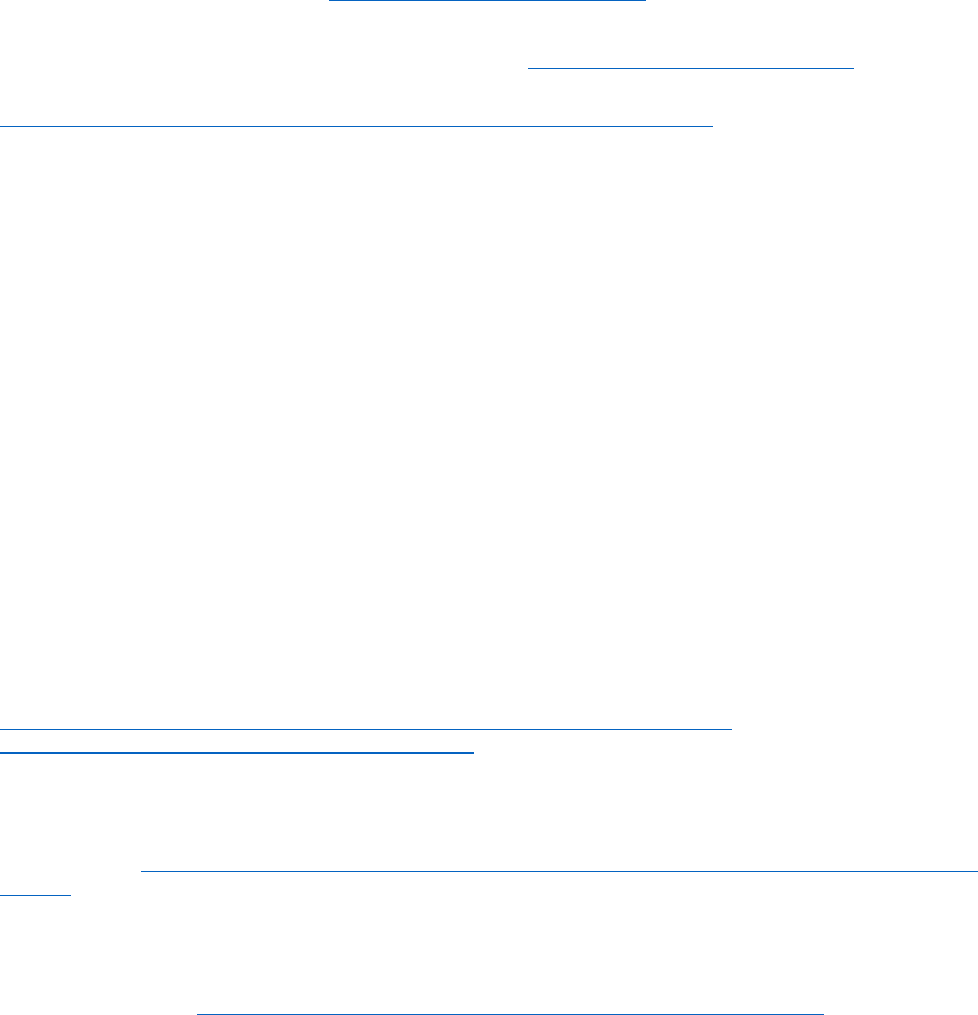
50
Glavinic, T. (2010). Research Shows Lack of Support for Transgender and Gender-Nonconforming Youth in U.S. School Systems. Inquiries
Journal/Student Pulse, 2(01). Retrieved from http://www.inquiriesjournal.com/a?id=135
Glisic, M., & Favaro, P. (2017). Destreaming research report. Mississauga, ON: Peel District School Board.
Government of Ontario. (1990). Education Act, R.S.O. 1990, c. E.2. Retrieved from https://www.ontario.ca/laws/statute/90e02
Government of Ontario. (2019). Data Standards for the Identification and Monitoring of Systemic Racism. Retrieved from
https://www.ontario.ca/document/data-standardsidentification-and-monitoring-systemic-racism
Gray, E., Bailey, R., Brady, J., & Tecle, S. (2016). Perspectives of Black Male Students in Secondary School: Understanding the Successes and
Challenges—Student Focus Group Results. Mississauga, ON: Peel District School Board.
Greflund, S., McIntosh, K., Mercer, S. H. and May, S. L. (2014). Examining disproportionality in school discipline for Aboriginal students in schools
implementing PBIS. Canadian Journal of School Psychology, 29(3), 213-235.
Gregory, A., Skiba, R.J., Noguera, P.A. (2010). The achievement gap and the discipline gap: Two sides of the same coin? Educational Researcher,
39(1), 59-68.
Han, J. (2021). Secondary education in Ontario: Effective strategies for prejudice reduction between Indigenous and non-Indigenous communities.
Sustinere 1(1), 26-52.
Haight, W., Kayama, M., & Gibson, P. A. (2016). Out-of-school suspensions of Black youths: Culture, ability, disability, gender, and perspective.
Social work, 61(3), 235-243.
Hascher, T.,& Hagenauer, G. (2010). Alienation from school. International Journal of Educational Research, 49(6), 220-232
Howard, T. C. (2008). Who really cares? The disenfranchisement of African American males in PreK-12 schools: A critical race theory perspective.
Teachers College Record, 110(5), 954-985.
James, C. (2004). Stereotyping and its consequence for racial minority youth. Race Policy Dialogue Papers, Ontario Human Rights Commission.
Retrieved from: https://www.ohrc.on.ca/en/race-policy-dialogue-papers/stereotyping-and-its-consequence-racial-minority-youth
James, C. E. (2009). Masculinity, racialization and schooling: The making of marginalized men. In W. Martino, W. Kehler, & M. W. Hightower (Eds.),
The “boy problem”: Interrogating issues of masculinity and schooling (pp. 102-123). New York, NY: Haworth Press.
James, C. E. (2012). Life at the intersection: Community, class and schooling. Halifax, NS: Fernwood.
James, C. E. (2019a). We Rise Together. Peel District School Board. Retrieved from
https://www.peelschools.org/about/inclusion/Documents/We%20Rise%20Together%20report%20-
%20Carl%20E%20James%20June%202019.pdf?csf=1&e=XnmaYZ
James, C. E. (2019b). Adapting, Disrupting, And Resisting: How middle school Black males position themselves in response to racialization in
schools. Canadian Journal of Sociology, 44(4), 373-398.
James, C. E. (2020). Racial Inequity COVID-19 And the Education of Black and Other Marginalized Students. The Royal Society of Canada. 1-
10. Retrieved from https://rsc-src.ca/en/covid-19/impact-covid-19-in-racialized-communities/racial-inequity-covid-19-and-education-
black-and
James, C. E., & Turner, T. (2015). FACES Report, Fighting an Uphill Battle. Retrieved from
http://www.bcanpeel.com/wpcontent/uploads/2016/11/fighting-an-uphill-battle-sm.pdf
James, C. E., & Turner, T. (2017). Towards race equity in education: The schooling of Black students in the Greater Toronto Area. Toronto, ON: York
University. Retrieved from https://edu.yorku.ca/files/2017/04/Towards-Race-Equity-in-Education-April-2017.pdf
Klemmer. C., Rusow, J. A., Goldbach, J. T., Kattari, S. K., & Rice, E., (2019). Socially assigned gender nonconformity and school violence experience
among transgender and cisgender adolescents. Journal of Interpersonal Violence 36(15-16). DOI:10.1177/0886260519844781
Kosciw, J. G, Palmer, N. A., Kull, R., & Greytak, E. A. (2013) The Effect of Negative School Climate on Academic Outcomes for LGBT Youth and the
Role of In-School Supports. Journal of School Violence, 12(1), 45-63.
Kramarczuk Voulgarides, C., Fergus, E., & King Thorius, K. A. (2017). Pursuing equity: Disproportionality in special education and the reframing of
technical solutions to address systemic inequities. Review of Research in Education, 41(1), 61-87.
Krezmien, Leone, & Achilles (2006)
Ladson-Billings, G. (1998) Just what is critical race theory and what’s it doing in a nice field like education? International Journal of Qualitative
Studies in Education, 11(1), 7-24.
Lareau, A. (2011). Unequal childhoods: Class, race, and family life (2
nd
ed.). Berkeley, CA: University of California Press.

51
Lee, V. E., & Burkam, D. T. (2002). Inequality at the starting gate: Social background differences in achievement as children begin school.
Washington, DC: Economic Policy Institute
Lee, J., Zhang, Y. and Stankov, L. (2019). Predictive validity ofminis measures for student achievement. Educational Assessment, 24(4), 305-326.
Lindsay, C. A., & Hart, C.M.D. (2017). Exposure to same-race teachers and student disciplinary outcomes for Black students in North Carolina.
Educational Evaluation and Policy Analysis, 39(3), 485-510. https://doi.org/10.3102%2F0162373717693109
Losen, D., Hodson, C., Ee, J., & Martinez, T. (2014). Disturbing inequities: Exploring the relationship between racial disparities in special education
identification and discipline. Journal of Applied Research on Children, 5(2), 15.
Meek, S. E. and W. S. Gilliam. 2016. Expulsion and Suspension in Early Education as Matters of Social Justice and Health Equity. NAM Perspectives.
Discussion Paper, National Academy of Medicine, Washington, DC. https://doi.org/10.31478/201610e
Meinck, S. and Brese, F. (2019). Trends in gender gaps: Using 20 years of evidence from TIMSS. Large-scale Assessment in Education 7(8),
https://doi.org/10.1186/s40536-019-0076-
Napierala, J., Favaro, P. and Bennett, K. (2019). The socioeconomic vulnerability index (SVI) 2017. Mississauga, ON: Peel District School Board.
Retrieved from https://www.peelschools.org/about/researchaccountability/reports-publications/Documents/The-Socioeconomic-
Vulnerability-Index-(SVI)-2017.pdf
Noltemeyer, A. L., & Mcloughlin, C. S. (2010). Changes in Exclusionary Discipline Rates and Disciplinary Disproportionality over Time. International
Journal of Special Education, 25(1), 59-70.
Ontario Agency for Health Protection and Promotion (Public Health Ontario) (2020). COVID-19 in Ontario – A Focus on Diversity: January 15, 2020
to May 14, 2020 Toronto, ON: Queen’s Printer for Ontario. Retrieved from https://www.publichealthontario.ca/-
/media/documents/ncov/epi/2020/06/covid-19-epi-diversity.pdf?la=en
Ontario Education and Training. (2022, July 11). School suspensions and expulsions. Education and Training. https://www.ontario.ca/page/school-
suspensions-and-expulsions
Ontario Ministry of Education. (2007). English Language Learners: ESL and ELD Programs and Services: Policies and Procedures for Ontario
Elementary and Secondary Schools, Kindergarten to Grade 12. Toronto, ON: Queen’s Printer for Ontario. Retrieved from
https://www.edu.gov.on.ca/eng/document/esleldprograms/esleldprograms.pdf
Ontario Ministry of Education. (2017). Special education in Ontario: Kindergarten to Grade 12. Retrieved from: https://files.ontario.ca/edu-special-
education-policy-resource-guide-en-2022-05-30.pdf
Ontario Ministry of Education. (2020). Minister’s Directions to the Peel District School Board. Retrieved from https://files.ontario.ca/edu-minister-
directions-pdsb-review-en-2022-05-26.pdf
Pampati, S., Andrzejewski, J., Sheremenko, G., Johns, M., Lesesne, C. A., & Rasberry, C. N. (2020). School climate among transgender high school
students: An exploration of school connectedness, perceived safety, bullying, and absenteeism. The Journal of School Nursing, 36(4), 293-
303.
Parekh, G., & Brown, R. S. (2019). Changing lanes: The relationship between special education placement and students’ academic futures.
Educational Policy, 33(1), 111-135. Artiles, A. J., Harry, B., Reschly, D. J., & Chinn, P. C. (2002). Over-identification of students of color in
special education: A critical overview. Multicultural perspectives, 4(1), 3-10.
Parekh, G., Brown, R. S., & Robson, K. (2018). The social construction of giftedness: The intersectional relationship between whiteness, economic
privilege, and the identification of gifted. Canadian Journal of Disability Studies, 7(2), 1-32.
Parekh, G., Brown, R. S., & Zheng, S. (2021). Learning Skills, System Equity, and Implicit Bias Within Ontario, Canada. Educational Policy, 35(3), 395-
421.
Paul, D.G. and Araneo, J. (2019). “Orange is the New Black” comes to New Jersey’s public schools: Black girls and disproportionate rates of out-of-
school suspensions and expulsions. The Urban Review, 51, 326-343. https://doi.org/10.1007/s11256-018-0483-8
Peel District School Board (PDSB) (2021a). One-Year Peel Board Community Update. Mississauga, Ontario. Retrieved from
https://peelschools.org/about/ministrydirectives/Documents/One-Year-PDSB-Community-Update_Ministry-of-Education-Directives-
(1).pdf
Peel District School Board (PDSB) (2021b). Online Learning Student and Parent/Caregiver Survey Results. Retrieved from
https://www.peelschools.org/documents/16.6_OnlineLearningStudentandParentCaregiverSurveyResults.pdf/16.6_OnlineLearningStuden
tandParentCaregiverSurveyResults.pdf
Perry, L. and McConney, A. (2013). School socioeconomic status and student outcomes in reading and mathematics: A comparison of Australia and
Canada. Australian Journal of Education, 57(2), 124-140.

52
Petras, H., Masyn, K.E., Buckley, J.A., Ialongo, N.S. and Kellam, S. (2011). Who is most at risk for school removal? A multilevel discrete-time survival
analysis of individual- and context-level influences. Journal of Educational Psychology, 103(1), 223-237. https://doi.org/10.1007/s11256-
018-0483-8
Poteat, V. P., Scheer, J.R., & Mereish, E. H. (2014). Factors affecting academic achievement among sexual minority and gendervariant youth.
Advances in Child Development and Behavior, 47, 261-300.
Region of Peel (2020, August). COVID-19 and the social determinants of health: Race and occupation. Retrieved from
https://www.peelregion.ca/coronavirus/_media/COVID-19-race-and-occupation.pdf
Robson, K., Anisef, P., & Brown, R. (2016). “Identifying the complexity of barriers faced by marginalized youth in transition to postsecondary
education in Ontario”, in Wolfgang Lehmann (Ed), Education and Society: Canadian Perspectives. London: Oxford University Press, 2016.
Rolland, K.M. (2020). COVID-19, “learn at home,” & students with disabilities in Ontario. International Human Rights Internship Program, Working
Paper Series, 9(1), 1-40
Sekaly, F.G. & Bazzi, R. (2021). A critical perspective on the Canadian education gap: Assessing First Nation student education outcomes in Canada.
StrategyCorp Institute of Public Policy and Economy. https://strategycorp.com/wpcontent/uploads/2021/05/SCI-First-Nations-
Education_Final.pdf
Selkie, E. M. (2018). Gender Diversity and Adolescent Wellbeing. JAMA Pediatrics 172(11), DOI:10.1001/jamapediatrics.2018.2917.
Skiba, R. J., Horner, R. H., Chung, C. G., Rausch, M. K., May, S. L. and Tobin, T. (2011). Race is not neutral: A national investigation of African
American and Latino disproportionality in school discipline. School Psychology Review, 40(1), 85-107.
Solórzano, D. G., & Yosso, T. J. (2002). Critical race methodology: Counter-storytelling as an analytical framework for education research.
Qualitative Inquiry, 8(1), 23-44.
Statistics Canada. (2019). Students’ experiences of discrimination based on gender, gender identity or sexual orientation at postsecondary schools
in the Canadian provinces, 2019. Retrieved from: https://www150.statcan.gc.ca/n1/pub/85-005-x/2020001/article/00001-eng.htm
Sullivan, A. L., Van Norman, E. R. and Klingbeil, D. A. (2014). Exclusionary discipline of students with disabilities: Student and school characteristics
predicting suspension. Remedial and Special Education, 35(4), 199-210.
Van Eck, K., Johnson, S. R., Bettencourt, A., & Johnson, S. L. (2017). How school climate relates to chronic absence: A multi–level latent profile
analysis. Journal of School Psychology, 61, 89-102.
Voyer, D. and Voyer, S. D. (2014). Gender differences in scholastic achievement: A meta-analysis. Psychological Bulletin, 140(4), 1174-1202.
Wilkins-Laflamme, S. (2018). Islamophobia in Canada: Measuring the realities of negative attitudes toward Muslims and religious discrimination.
Canadian Review of Sociology, 55(1), 86-110.
Williams, S. G. (2017). Mental Health Issues Related to Sexual Orientation in a High School Setting. The Journal of School Nursing, 33(5), 383-392.
Wolf, K. C. and Kupchik, A. (2017). School suspensions and adverse experiences in adulthood. Justice Quarterly, 34(3), 407- 430.
Woodford, M. R. and Kulick, A. (2014). Academic and social integration on campus among sexual minority students: The Impacts of psychological
and experiential campus climate. Community Psychology, 55, 13-24.
Wun, C. (2016). Against captivity: Black girls and school discipline policies in the afterlife of slavery. Educational Policy, 30(1), 171-196.
https://doi.org/10.1177%2F0895904815615439
Yang, M. Y., Harmeyer, E., Chen, Z. and Lofaso, B. M. (2018). Predictors of early elementary school suspension by gender: A longitudinal multilevel
analysis. Children and Youth Services Review, 93, 331-338.
