
INTERNATIONAL TRADE ADMINISTRATION
INTERIM STUDY AND REPORT TO CONGRESS ON THE
EFFECTS OF THE COVID–19 PANDEMIC ON THE
TRAVEL AND TOURISM INDUSTRY IN THE UNITED STATES
Prepared in Response to the Consolidated Appropriations Act, 2023 (Public Law 117-328).
Marisa Lago
Under Secretary for International Trade
Grant Harris
Assistant Secretary for Industry and Analysis
National Travel and Tourism Office

2
The Consolidated Appropriations Act, 2023 (Public Law 117-328), Division BB, Title VI,
Subtitle B, entitled, “Travel Safety,” included the following language:
“(b) INTERIM STUDY AND REPORT. —
(1) IN GENERAL. — Not later than 3 months after the date of the enactment of this Act,
the Secretary, after consultation with relevant stakeholders, including the United States
Travel and Tourism Advisory Board, shall —
(A) complete an interim study, which shall be based on data available at the time
the study is conducted and provide a framework for the study required under
subsection (c), regarding the effects of the COVID-19 pandemic on the travel and
tourism industry, including various segments of the travel and tourism industry,
such as domestic, international, leisure, business, conventions, meetings, and
events; and
(B) submit a report containing the results of such interim study to —
(i) the Committee on Commerce, Science, and Transportation of the
Senate; and
(ii) the Committee on Energy and Commerce of the House of
Representatives.
(2) AVAILABILITY. — The Secretary shall make the report described in paragraph (1)
publicly available on the website of the Department of Commerce.”
This Interim Study and Report responds to this requirement in the law.

3
TABLE OF CONTENTS
I. Executive Summary 4
II. The Pre-Pandemic U.S. Travel and Tourism Industry 5
A. Overview of the U.S. Travel and Tourism Industry 5
B. Domestic Travel Volume and Consumer Intentions Leading 6
Up to the Pandemic
C. International Visitation and Spending Leading Up to the Pandemic 6
III. The Government and Industry Responses to COVID-19 7
A. Government Efforts to Address Health Impacts 8
B. Government Efforts to Provide Economic Support 11
C. The 2022 National Travel and Tourism Strategy 12
IV. The Pandemic’s Impacts on the U.S. Travel and Tourism Industry 13
A. Effects on Travel and Tourism Industry Output from the Pandemic 13
B. Effects on Travel and Tourism Employment from the Pandemic 17
C. Effects on Travel and Tourism Real Output from the Pandemic 19
V. International Visitation To and From the United States 19
VI. Data Unavailable at the Time of the Study 22
VII. Conclusion 24

4
I. Executive Summary
The National Travel and Tourism Office (NTTO) is the official U.S. government source for
travel and tourism statistics. As part of the U.S. Department of Commerce (Commerce)
International Trade Administration’s Industry & Analysis business unit, NTTO works to enhance
the international competitiveness of the U.S. travel and tourism industry and increase its exports,
thereby creating U.S. employment and economic growth.
Division BB, Title VI, Subtitle B of the Consolidated Appropriations Act for Fiscal Year 2023
(Public Law 117-328) requires the Secretary of Commerce to conduct an interim study, based on
data available at the time of the study, regarding the effects of the COVID-19 pandemic on the
travel and tourism industry. The law requires the Secretary to consult with relevant stakeholders,
including the United States Travel and Tourism Advisory Board (TTAB) before submitting a
report containing the results of such an interim study to designated committees of Congress.
NTTO manages the TTAB, which serves as an advisory body to the Secretary on matters relating
to the travel and tourism industry in the United States and provides the private sector’s views and
recommendations on government policies and programs that affect the industry.
The Secretary has delegated her responsibility for collecting, analyzing, and disseminating travel
and tourism statistics to NTTO. Therefore, this report responds to the requirement in P.L. 117-
328 by providing NTTO’s analysis of relevant data as well as input sought from the TTAB and
other stakeholders regarding the effects of the pandemic on the travel and tourism industry.
The report first reviews the economic state of the travel and tourism industry before COVID-19
became a global pandemic. It then describes government actions that addressed the health and
economic impacts of the pandemic. Relying on available data, the report analyzes how these
decisions that led to restrictions on travel and normal business operations affected the travel and
tourism industry. The report then describes some trends in international travel to and from the
United States, then concludes with a discussion of which data was unavailable at the time of this
study and our plans for identifying such information to include in the next report to Congress.
As described in detail below, the report concludes that the pandemic had a devastating impact on
the travel and tourism industry in the United States. While the decade leading up to the
pandemic saw rapid growth in this sector, COVID-19 halted and then reversed all gains made
during that time. The number of domestic trips declined 31.8%, international visitation declined
75.8%, and the loss of 4.4 million jobs in travel and tourism accounted for nearly half of the
entire employment decline in the United States.
This resilient industry is beginning to recover, but it is not yet at the level it was in the years
preceding the pandemic. With ongoing economic uncertainties and a slow return of international
inbound travel, a full recovery may not be realized for a few more years.

5
II. The Pre-Pandemic U.S. Travel and Tourism Industry
A. Overview of the U.S. Travel and Tourism Industry
Travel and tourism is a critical driver of economic growth and employment in the United States,
accounting for nearly 3% of U.S. gross domestic product (GDP). Supporting 9.9 million
American jobs that pay more than $322 billion in employee compensation, and through $2
trillion of economic activity, approximately one in every 20 jobs in the United States relies
directly or indirectly on travel and tourism. According to the U.S. Travel Association, small
businesses account for 83 percent of all travel and tourism industry businesses
1
.
“Before the pandemic, the travel industry offered an unobstructed path to the
middle-class, providing the first job for nearly four in 10 (38%) Americans
without significant disparities in gender, race and ethnicity. The travel industry
was one of the top 10 largest employers of middle-class wage earners, free of the
entry barriers that burdened workers in other industries, such as post-secondary
education pre-requisites.” – U.S. Travel Association.
Travel and tourism is an engine of prosperity and opportunity for many Americans and in most
communities. All 50 states, the District of Columbia, and the U.S. territories benefit directly or
indirectly from domestic travel and international visitation.
Figure 1 below illustrates how the economic power of travel extends to ancillary industries,
supporting small and large businesses across the country. These jobs are in a wide range of
industries such as transportation, accommodations, food services, retail, attractions, recreation,
sports, arts, entertainment, education, agriculture, infrastructure, and logistics.
Figure 1: Power of Travel
1
Source: U.S. Travel Applauds Small Business Relief Bill | U.S. Travel Association (ustravel.org)
Source: U.S. Travel Association

6
Travel and tourism is a unique industry. Unlike others that are defined by the type of product or
service delivered to customers, travel and tourism is defined not by the product or service, but
rather by the customer, who is referred to as a “visitor.”
The Travel and Tourism Satellite Account (TTSA) is produced by Commerce’s Bureau of
Economic Analysis and managed by NTTO as the official source of the federal government’s
estimate of the size and importance of the travel and tourism industry.
The TTSA defines a “visitor” as a person who travels outside his or her usual environment (more
than 50-100 miles from the area of normal, everyday activities) for less than a year or who stays
overnight in paid accommodations.
Visitors include both domestic travelers and international visitors but exclude travelers who are
expected to be compensated at the location of their visit (such as migrant workers, persons
traveling to new assignments, and diplomatic and military personnel traveling to and from their
duty stations and their home countries).
The visitor may travel for business or pleasure, from the private sector or government. Four
types of visitors generate travel demand in the United States: (1) domestic leisure visitors,
(2) domestic business visitors, (3) domestic government visitors, and (4) international inbound
visitors.
B. Domestic Travel Volume and Consumer Intentions Leading Up to the Pandemic
In the year 2019, the outlook for travel and tourism was strong. According to The Conference
Board, 43.3% of American consumers reported that they intended to take a domestic vacation
within the next six months, which was the highest share of such consumer sentiment since 45.5%
was recorded in 1987. Likewise, a record 13.2% of American consumers reported that they
intended to take an international vacation in 2019.
According to the U.S. Travel Association, for ten consecutive years leading up to 2019, domestic
travel volume grew annually, from 1.9 billion person-trips in 2009 to 2.3 billion in 2019, an
increase of 22.1%.
A “person-trip” is defined as one person on a trip away from home overnight in paid
accommodations, or on a day or overnight trip to a place 50 miles or more, one-way, away from
home. In the year before the pandemic, 1.9 billion person-trips were for leisure and 464 million
were for business, and 2.1 billion were by auto, while 189 million were by air.
C. International Visitation and Spending Leading Up to the Pandemic
The United States has long been a top destination for global travelers. According to the United
Nations World Tourism Organization, the United States generates more travel exports than any
other country.
7
The decade leading up to 2020 was a period of broad-based growth in international travel into
and out of the United States. International visitor arrivals to the United States increased 44.2%
from 55.1 million in 2009 to 79.4 million in 2019. Likewise, international outbound departures
from the United States increased 156.8% from 38.8 million in 2009 to 99.7 million in 2019.
2
In 2009, travel exports (revenues from international visitor spending in the United States) of
$137 billion minus travel imports (money spent by Americans traveling outside the United
States) of $115 billion generated a $22 billion trade surplus. By 2019, travel exports of $239
billion minus travel imports of $185 billion generated $54 billion, significantly more than
doubling the trade surplus in ten years.
During this decade leading up to the pandemic, travel and tourism accounted for 9.3% of total
U.S. exports of goods and services, and in 2019, travel remained the top services export for the
United States that year.
III. The Government and Industry Responses to COVID-19
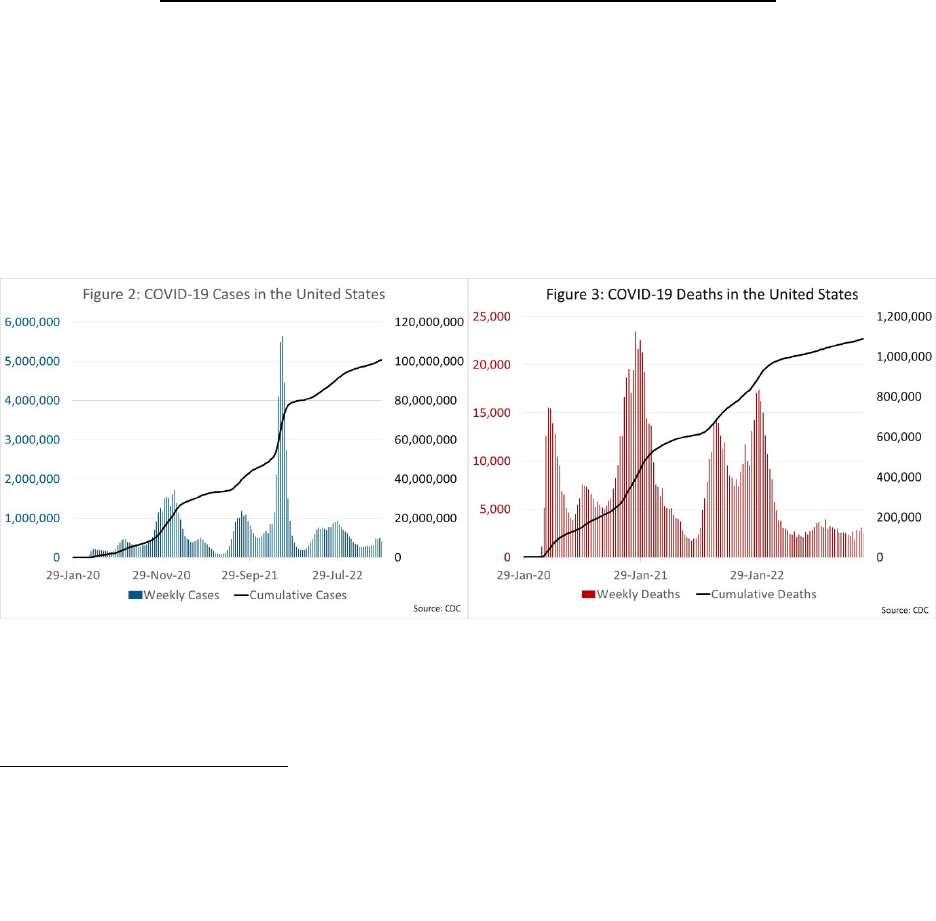
The first COVID-19 case in the United States was reported by the Centers for Disease Control
and Prevention (CDC) in the last week of January 2020, and the first death attributed to the virus
was reported during the week of March 4, 2020.
Data demonstrating the quick spread of the virus are noted in Figures 2 and 3 below, showing
that in the week of April 29, 2020, the cumulative COVID-19 cases in the United States totaled 1
million and deaths totaled 63,800. By the week of December 21, 2022, the cumulative COVID-
19 cases in the United States totaled 100.2 million and deaths totaled nearly 1.1 million.
2
Source: U.S. Department of Commerce/ITA/I&A/National Travel and Tourism Office/ ADIS/I-94 Program and
APIS/1-92

8
A. Government Efforts to Address Health Impacts
In response to the pandemic, the United States, along with most nations around the world,
enacted a series of laws, regulations, and policies to combat the spread of the pandemic and
provided funding to support those impacted by the economic fallout from the global shutdowns.
The following actions impacted the flow of travel into and out of the United States:
January 2020:
• CDC and the Department of Homeland Security’s Customs and Border Protection
implement enhanced health screenings for those traveling to the United States on direct
or connecting flights from Wuhan, China.
• CDC urges Americans to avoid travel to China.
• U.S. airlines suspend flights to China.
February 2020
• The President suspends entry into the United States of most visa holders traveling from
China, and CDC expands entry screening to include all other air passengers from China,
redirecting these passengers to 11 designated U.S. airports.
• CDC expands the list of countries to which Americans are advised not to travel.
March 2020:
• U.S. Department of State issues global health advisory for all international travel.
• Presidential proclamations suspend entry to the Unites States of all foreign nationals
traveling from Iran and certain European countries.
• DHS imposes temporary restrictions at land border ports of entry and ferry terminals at
the U.S.-Canada and U.S.-Mexico borders on nonessential travel.
• CDC issues a No-Sail Order for traveling on cruise lines.
• CDC advises against international travel globally, including cruise travel.
• CDC issues an Order Suspending Introduction of Certain Persons From Countries
Where a Communicable Disease Exists suspending the introduction of covered
noncitizens traveling from Canada or Mexico at the land border.
April 2020:
• CDC No-Sail Order extended through July 2020.
May 2020:
• The President suspends entry into the United States of noncitizens from Brazil and public
health screening operations are expanded to include air passengers from Brazil at 15 U.S.
airports.
July 2020:
• CDC No-Sail Order extended through September 2020.

9
August 2020:
• CDC moves from issuing global to country-specific travel health recommendations.
September 2020:
• Public health screening of air passengers at 15 airports is discontinued.
• CDC No-Sail Order extended through October 2020.
October 2020:
• CDC No-Sail Order expires.
• CDC adopts a phased approach to resuming cruise ship passenger operations under the
Framework for Conditional Sailing Order.
December 2020:
• Following identification of the Alpha variant, CDC announces requirement of negative
COVID-19 test or documentation of recovery from COVID-19 from all air passengers
boarding a flight from the United Kingdom to the United States.
January 2021:
• CDC expands requirement of negative COVID-19 test or documentation of recovery
from COVID-19 to all air passengers boarding a flight to the United States from any
foreign country.
• President suspends entry into the United States of noncitizens from South Africa.
April 2021:
• CDC issues updated guidance for domestic and international travel for those who are
fully vaccinated against COVID-19.
• CDC releases Phase 2A Technical Instructions under the Framework for Conditional
Sailing Order which assists cruise ship operators in documenting the approval of U.S.
port and local health authorities to resume passenger voyages in their jurisdictions.
May 2021:
• After the identification of the Delta variant, the President suspends entry into the United
States of noncitizens from India.
• CDC releases Phases 2B and 3 under the Framework for Conditional Sailing Order,
providing cruise lines the guidance they need to resume sailing with passengers.
June 2021:
• CDC updates the assessment criteria for travel health notices to be more country-specific
and reflect the current state of the pandemic, which eased travel recommendations for
many destinations.
• Cruise lines resume passenger service under the terms of the Framework for Conditional
Sailing Order.

10
August 2021:
• The Canadian government allows vaccinated Americans to travel to Canada.
• The European Union removes the United States from its list of safe countries.
October 2021:
• CDC extends the Framework for Conditional Sailing Order until January 2022.
November 2021:
• President terminates the suspension of entry into the United States regarding China, Iran,
the Schengen Area of Europe, the United Kingdom and Ireland, Brazil, South Africa, and
India.
• President directs CDC to issue public health precautions to protect against the public
health risk posed by travelers entering the United States. CDC issues subsequent orders
tightening COVID-19 testing requirements to 1 day before departure for unvaccinated air
passengers and requiring non-U.S. citizen nonimmigrant air passengers to show proof of
COVID-19 vaccination before boarding a flight to the United States.
• After the Omicron variant was identified, the President suspends entry into the United
States for foreign nationals who have been in Botswana, Eswatini, Lesotho, Malawi,
Mozambique, Namibia, South Africa, or Zimbabwe.
December 2021:
• The President lifts restrictions on travel from the above eight African countries.
• CDC announces tightening of travel policies and requires all incoming international air
passengers be tested within 1 day of departure, regardless of vaccination status.
• CDC issues elevated warning for traveling on cruise lines because of increased
transmissibility of the Omicron variant.
January 2022:
• DHS announces that all non-U.S. citizen non-lawful permanent residents crossing at U.S.
land border ports of entry or ferry terminals will be required to be fully vaccinated and
show proof of vaccination.
• CDC Framework for Conditional Sailing Order expires.
• CDC implements a voluntary COVID-19 risk mitigation program for cruise ships.
March 2022:
• CDC removes its travel health recommendations for cruise ships.
April 2022:
• CDC updated the assessment criteria for travel health recommendations to reflect the
current state of the pandemic which eased travel recommendations for many destinations.
June 2022:
• CDC announces the end of its requirement for negative COVID-19 test or documentation
of recovery from COVID-19 for all air passengers boarding a flight to the United States.

11
July 2022:
• CDC's voluntary COVID-19 risk mitigation program for cruise ships ends.
October 2022:
• CDC stops issuing COVID-19 travel health recommendations for countries.
December 2022:
• CDC announces requirement of negative COVID-19 test or documentation of recovery
from COVID-19 for all air passengers boarding a flight from China, Hong Kong, and
Macau, as well as passengers from China transiting through Incheon, Toronto, and
Vancouver to the United States.
March 2023:
• CDC announces the end of its requirement for negative COVID-19 test from all air
passengers entering the United States from China.
B. Government Efforts to Provide Economic Support
As soon as the global pandemic became evident, Congress began working on laws to confront
the economic concerns resulting from the pandemic and to assist certain industries, individuals,
and local and state governments with their recovery efforts.
In March 2020, Congress passed the Coronavirus Aid, Relief, and Economic Security (CARES)
Act, which provided $2.2 trillion in federal support for a decade of financial relief for certain
American businesses and workers devastated by the pandemic. This major bipartisan law tasked
several federal agencies with creating programs targeted to identifiable groups. Assistance to air
carriers in Division A, Title IV of the CARES Act included loans and loan guarantees, funds to
support the pay and benefits of air carrier workers, and a suspension of aviation excise taxes on
air transport of people, cargo, and aviation fuel through calendar year 2020.
A signature program in the CARES Act was the Paycheck Protection Program (PPP),
implemented by the U.S. Small Business Administration (SBA) with support from the
Department of the Treasury. The PPP provided small businesses with funds to pay up to eight
weeks of payroll costs, including benefits. Funds were also used to pay interest on mortgages,
rent, and utilities, and toward job retention and certain other expenses. The CARES Act also
directed the Federal Reserve to establish the Main Street Lending Program to assist “mid-sized”
U.S. firms that were too large to be eligible for the PPP, but too small to issue bonds or
commercial paper, which the Fed purchased through other emergency programs.
In December 2020, Congress passed the Coronavirus Response and Relief Supplemental
Appropriations Act which provided an additional $915 billion in support for a variety of federal
programs to assist those impacted by the pandemic.

12
In March 2021, Congress passed the American Rescue Plan Act (ARPA) which provided an
additional $1.9 trillion in federal support. Of this amount, $8 billion in grants was provided to
airports, with $800 million for airport concessionaires, and $15 billion for payroll support.
ARPA provided Commerce’s Economic Development Administration with $3 billion in funding,
from which $750 million (25%) was set aside for eligible states and communities that suffered
economic injury due to losses in the travel, tourism, or outdoor recreation sectors.
The decision to target ARPA funds to the travel and tourism industry came as a direct result of a
recommendation of the TTAB, which met with the Secretary of Commerce in early 2021 to
discuss ways Commerce could assist with pandemic recovery.
C. The 2022 National Travel and Tourism Strategy
On June 6, 2022, Commerce released the National Travel and Tourism Strategy, which was
recommended by the TTAB and developed through the Tourism Policy Council, an interagency
working group chaired by the Secretary of Commerce.
Among other federal entities, the Departments of State, Homeland Security, Transportation,
Interior, Labor, and Agriculture, and the National Security Council, Environmental Protection
Agency, SBA, and CDC provided significant input into developing this document.
This blueprint brings a whole-of-government approach to supporting the recovery of the travel
and tourism sector by focusing efforts to promote the United States as a premier global
destination. The Strategy sets an ambitious goal of attracting 90 million international visitors by
2027, who are estimated to spend $279 billion annually.
The federal government is working to implement the strategy through a four-point approach:
1. Promote the United States as a Travel Destination: Leverage existing programs and
assets to promote the United States to international visitors and broaden marketing efforts
to encourage visitation to underserved communities.
2. Facilitate Travel to and Within the United States: Reduce barriers to trade in travel
services and make it safer and more efficient for visitors to enter and travel within the
United States.
3. Ensure Diverse, Inclusive, and Accessible Tourism Experiences: Extend the benefits of
travel and tourism by supporting the development of diverse tourism products, focusing
on under-served communities and populations; address the financial and workplace needs
of travel and tourism businesses, supporting destination communities as they grow their
tourism economies; and deliver world-class experiences and customer service at federal
lands and waters that showcase the nation’s assets while protecting them for future
generations.

13
4. Foster Resilient and Sustainable Travel and Tourism: Reduce travel and tourism’s
contributions to climate change; build a travel and tourism sector that is more resilient to
natural disasters, public health threats, and the impacts of climate change; and build a
sustainable sector that integrates protecting natural resources, supporting the tourism
economy, and ensuring equitable development.
IV. Pandemic’s Impacts on the U.S. Travel and Tourism Industry
The unanticipated, sudden, and drastic travel and health restrictions caused by the pandemic
resulted in severe economic loss for the travel and tourism industry in the United States. As
detailed below, this industry suffered catastrophically and more quickly than most other sectors
in the United States.
A. Effects on Travel and Tourism Industry Output from the Pandemic
In addition to managing the federal government’s official data on the size and importance of the
travel and tourism industry, the TTSA serves as an economic tool to measure the industry’s
contribution to and its impact on other industries.
The TTSA estimates that the total commodity output multiplier for travel and tourism results in
an additional $0.73 of economic output in ancillary industries for every $1 of direct tourism
output. In other words, when travel and tourism as an industry grows, it becomes a force
multiplier with compounding economic benefits across many other industries throughout the
U.S. economy.
Conversely, when a global crisis, such as the September 11 terrorist attacks, SARS, Avian Flu, or
a global economic recession, negatively impacts people’s ability to travel, other industries suffer
as well. Thus, based on TTSA estimates, a $10 billion decline in direct travel and tourism output
would cost the U.S. economy more than $17 billion.
Many of the travel restrictions listed above focused on international travel, but the shut down and
the need to shelter in place impacted Americans’ ability to travel domestically as well. Fewer
domestic or international travelers resulted in less spending, which resulted in less demand for
travel and tourism-related goods and services, which resulted in less demand for labor.
Immediately prior to the pandemic, in 2019, travel and tourism in the United States produced a
record $2 trillion of economic output for the U.S. economy. Staples of the industry, such as
passenger air transportation, food and beverage services, accommodations, and shopping,
combined to produce nearly $1.3 trillion of economic output, accounting for nearly two-thirds
(63%) of total output in this sector.
In 2020 the global pandemic put an immediate halt to this burgeoning sector. Total travel and
tourism-related output plummeted more than 53%, from a little over $2 trillion in 2019 to less
than $952 billion in 2020, the lowest level since 1998.

14
Below are some additional perspectives on the effects on the travel and tourism industry from the
pandemic:
“By the week of March 22, 2020, Hostelling International experienced a 95%
decline, compared to 2019. By April 12, we were totally closed for five months.
Our revenues fell from $48 million in fiscal year 2019 to $1 million for all of
fiscal year 2021. As a small business, we needed to just sell property – about half
of our properties – and we laid off about 80% of our staff to survive the
pandemic.” – Russ Hedge, President and CEO, Hostelling International USA,
and TTAB Member.
“The pandemic caused travel unemployment to rise sharply to 51% in 2020, more
than twice the 25% unemployment rate the broader economy experienced during
the worst year of the Great Depression in 1933. Revenue losses were also ten
times greater than what the industry experienced in the aftermath of 9/11.
Americans stopped traveling and businesses stopped meeting in person.”
– U.S. Travel Association.
“For at least 22 months the pandemic disrupted cruise operations from U.S.
ports, with 15 of those months having no cruise operations, resulting in zero
domestic product as compared to 2019, when U.S. cruise operations were
responsible for 436,000 jobs and $55 billion to the U.S. economy. The majority of
jobs lost came from small and medium-sized U.S. businesses that support cruise
operations.” – Cruise Lines International Association.
“U.S. business travel spend lost $191 billion in 2020. It fell from $313 billion to
$122 billion peak-to-trough, according to the GBTA Business Travel Index report.
This represents a 61% decline.” – Global Business Travel Association.
Likewise, travel and tourism GDP declined by 52% during that critical one-year span. This
reduction was responsible for the entire decline in U.S. GDP between 2019 and 2020. Outside
travel and tourism, the rest of U.S. GDP increased 0.1% in 2020. As a result, travel and
tourism’s share of U.S. GDP declined from 3.0% in 2019 to 1.5% in 2020. Travel exports
declined by 65%, which was responsible for 40% of the overall decline in U.S. exports from
2019 to 2020. Meanwhile, the trade surplus in travel narrowed from 53.9 billion in 2019 to
$36.8 billion in 2020.
The State of Alaska documented, “$1.7 billion in direct [gross domestic product]
losses to the state, but it is important to recognize that the cruise industry and the
visitors they serve account for $3.0 billion of the state’s economy. Together with
induced and indirect impacts of reduced economic activity from the industry, the
$3.0 billion gross state product associated with the cruise industry has effectively
dropped to zero.” – Alaska Department of Revenue, Department of Commerce,
Community, and Economic Development, Department of Labor and Workforce
Development.

15
“The loss of arrivals and the collapse of a main pillar of Guam’s economy had
significant impacts to overall economic activity. According to estimates from the
U.S. Bureau of Economic Analysis, between 2019 and 2020, Guam’s economy
contracted by 11.4% with significant reductions seen in the exports of services
(-77.4%) and personal consumption of goods (-21.5%). The first year of the
pandemic saw the largest contraction of the economy in two decades, but the
impacts were partially offset by a 12.1% growth in local government
expenditures.” – COVID-19 Impact on the Commonwealth of the Northern
Mariana Island and Western Pacific Region, Tan Holdings.
The significant declines were unprecedented. While the industry has weathered many natural
disasters and unforeseen events that curtailed travel in the past, based on data available to NTTO,
never has this sector lost so much economic output virtually overnight.
“As a result of the COVID-19 pandemic and the governmental response to it, this
business came to an almost complete halt in March 2020 and remained there for
many months. Since early 2020, our members have had to grapple with a
succession of viral variants and complex, ever-changing government restrictions
on and warnings against travel. As a result, our sector’s recovery was painfully
slow, with average travel agency revenue levels still down 71% compared to 2019
according to ASTA member surveys as late as February 2022.” – American
Society of Travel Advisors.
For perspective, Figure 4 below indicates that adding all the individual declines in travel and
tourism output recorded in the past 25 years would be less than declines exhibited in 2020 alone.

16
Some positive signs are emerging on the industry’s road to recovery. As the world became
accustomed to living with certain restrictions, some people ventured out on safe travel options
and tourism experiences. Many businesses and workers identified creative ways to return to
work, and to reopen their shuttered retail operations.
As a result, the total industry output increased 79% to $1.7 trillion in 2021, reaching 83% of the
output generated in 2019. However, the recovery in 2021 was uneven, with domestic leisure
travel recovering much faster than international inbound travel.
As shown in Figure 5 below, by the year 2021:
• Residential household travel (58% of travel demand in 2019) reached 93% of pre-
pandemic levels.
• Domestic business travel (24% of travel demand in 2019) reached 89% of pre-
pandemic levels.
• Nonresident (international visitors) travel (15% of travel demand in 2019) reached
26% of pre-pandemic levels.
• Government travel (3% of travel demand in 2019) reached 67% of pre-pandemic
levels.

17
B. Effects on Travel and Tourism Employment from the Pandemic
Prior to the pandemic, U.S. travel and tourism employment reached its peak in 2019, increasing
2.6% from 2018 to a record-level 9.9 million U.S. jobs. By the following year, the pandemic
caused nearly 4.4 million of these jobs to be lost, a decrease of more than 44% and the lowest
level of industry employment ever recorded.
As shown in Figure 6, the decline in travel and tourism-supported employment accounted for
nearly half (47%) of the total 9.3 million employment decline in the United States in 2020.
Businesses closed as customers were forced to shelter in place and travel was restricted. In terms
of employment, restaurants (categorized as “food services and drinking places”) were hit
particularly hard. In 2020, total travel-supported employment in food services and drinking
places plunged to a little above 1 million jobs, which is less than half of the nearly 2.3 million
workers this sector had employed in 2019.
Less need for hotels and airlines led to two industry sectors--traveler accommodations and
passenger air transportation services--losing a combined 1.24 million jobs, which is similar to the
losses in the food services and drinking places sector.
Combined, job losses in these three travel-supported employment sectors (restaurants, hotels,
airlines) accounted for more than a quarter (26.8%) of the total employment loss in the United
States during 2020.

18
As with economic output discussed above, there are some positive signs pointing to recovery. In
2021, travel and tourism employment increased by nearly 752,000 jobs but remained 25% below
2019 levels.
Figure 7 shows that employment in the rest of the U.S. economy in 2021 was only 1.5% below
the 2019 level.
“For Las Vegas, our first COVID case was on March 5, 2020. We were closed by March
17. We unfortunately had to lay off 62,000 employees within literally two weeks, 35,000
in Las Vegas alone.” – William Hornbuckle, CEO and President, MGM Resorts, and
TTAB Chair.
“By the end of December 2022, total employment in Leisure & Hospitality [in
Puerto Rico] was 92,200, representing an 11% increase over pre-COVID levels.
Further, this sector now represents 9.7% of total employment on the Island,
compared to 9.1% pre-COVID. The gains in employment levels within Puerto
Rico’s leisure and hospitality sector far outpace the national average. As of
December 2022, U.S. employment levels in this sector were down 3% from pre-
COVID levels, whereas Puerto Rico saw an 11% increase over pre-COVID levels
at the same time . . . As further proof of the employment rebound experienced by
the Island’s tourism sector, employment in the accommodations sector was 3%
higher than it was in December 2019, and 13% higher in food service
establishments over the same time.” – Discover Puerto Rico.

19
C. Effects on Travel and Tourism Real Output from the Pandemic
When comparing the change in real GDP to the change in real travel and tourism industry output
(adjusted to account for changes in price), it is clear that the pandemic had a disproportionate
impact on the travel and tourism sector relative to the rest of the U.S. economy.
In 2020, overall real GDP declined 2.8%, which is similar to the 2.6% decline noted during the
2009 global recession. Yet, during the same time, the real U.S. travel and tourism industry
output declined by a staggering 50.7%.
This difference could be explained by the fact that when consumers were no longer able to travel
or to enjoy tourism experiences, they nevertheless continued to spend their discretionary funds
on other segments of the economy that were not as impacted by the pandemic. Thus, NTTO
concludes that this consumer spending behavior contributed to the decline in GDP being much
less steep than the decline in the travel and tourism sector.
By 2021, when travel restrictions lifted slightly and more businesses reopened, the real travel and
tourism output increased by 64.4%, compared to the 5.9% rise in real U.S. GDP. This is another
positive indication that the industry is slowly recovering. Yet, while overall U.S. GDP in 2021
was 3% above its level in 2019, the same cannot be said about the travel and tourism sector,
which remained 19% below its level in 2019.
“In real terms, once we recognize inflation, the industry in 2022 was still 14%
down from 2019 levels. When we look at where the industry would have been if it
were not for the pandemic, the industry cumulatively over these three years has
lost $1.1 trillion.” – Adam Sacks, President, Tourism Economics, and TTAB
Member.
Clearly, disparities exist in both the downturn and recovery phases of this sector compared to the
rest of the industries in the United States.
V. International Visitation To and From the United States
As mentioned above, in 2019, the last year before the pandemic, 79.4 million international
visitors traveled to the United States. In 2020, as many countries put in place travel restrictions,
international visitation to the United States fell drastically, dropping 75.8% to 19.2 million.
It is important to put this unprecedented decline in context. The last time the U.S. government
halted all flights in our national airspace was on September 11, 2001. Following those terrorist
attacks, consumer confidence declined, and passengers were reluctant to board airplanes. Thus,
it was not surprising to see a drop in international visitation to the United States in the yearlong
period following September 11, 2001, which was an 8.2% decline.
Similarly, international visitation to the United States between 2008 and 2009, when a global
recession stalled consumer spending, experienced a 5% decline. Therefore, a 75.8% decline in
visitation in one year due to the pandemic is indeed shocking.

20
As shown in Figure 8 below, in 2021, inbound travel to the United States recovered very slightly
from 2020, with only a 15% increase to 22 million. However, by 2022, after major travel
restrictions between the United States and other countries ended in November 2021, visitation
doubled to over 50 million, an increase of 128% from 2021.
“The number of total visitors to Los Angeles fell from 50,730,000 in 2019 to
26,940,000 in 2020, a 46.9% decline. The number of visitors increased to
39,100,000 in 2021 and 46,250,000 by 2022. To date, recovery has primarily
been driven by domestic leisure travel, while international visitation, individual
business travel, and professional meetings and events are projected to take
another 24-36 months to fully recover. The number of international visitors to
Los Angeles fell from 7,420,000 in 2019 to 1,620,000 in 2020, a 78.2% decline. In
2021 there was a further decrease in international visitors, with only 1,580,000
that year. International visitors began to return to Los Angeles in 2022, reaching
4,350,000 visitors. This segment is critical to the region’s recovery since
international guests stay longer and spend significantly more than their domestic
counterparts. Major inhibitors to international recovery include a lack of direct
air service to the United States relative to 2019 levels and lengthy visa wait
times.” – Los Angeles Tourism and Convention Board.
Figure 9 below analyzes these data in more detail, including how domestic and international
travel restrictions had impacts that are still lingering:

21
• In the first year of the pandemic, domestic person-trips fell from 2.3 billion in 2019 to
1.6 billion in 2020, a 31.8% decline. Domestic leisure trips fell 24.5%, while
domestic business trips fell 60.9%.
• In the second and third years of the pandemic, domestic travel was recovering. By
2022, domestic leisure travel increased to 1.6% above its 2019 level, while business
travel remained 20% below its 2019 level.
• In the first year of the pandemic, international inbound visitation to the United States
fell from 79.4 million in 2019 to 19.2 million in 2020, a 75.8% decline.
• In the second year of the pandemic, international inbound visitation to the United
States recovered slightly. By 2021, the visitation increased 15% to 22.1 million.
• By the third year of the pandemic, international inbound visitation to the United
States grew faster. By 2022, the visitation increased to 50.9 million.
In the first year of the pandemic, international outbound departures from the United States fell
from 99.7 million in 2019 to 33.5 million in 2020, a 66.3% decline.
• In the second and third years of the pandemic, international outbound departures from
the United States recovered significantly. By 2021, departures increased 48.1% to
49.1 million. By 2022, departures increased to 80.7 million.

22
VI. Data Unavailable at the Time of the Study
Section 611(b)(1) of Subtitle B, Title VI, Division BB of the Consolidated Appropriations Act,
2023 (P.L. 117-328) states that “the Secretary, after consultation with relevant stakeholders,
including Travel and Tourism Advisory Board, shall (A) complete an interim study based on
data available at the time the study is conducted. . . .”
Section 611(d) states that, in conducting the interim study (and the subsequent study due by the
end of 2023), the Secretary shall consider the following matters:
(1) changes in employment rates in the travel and tourism industry during the pandemic
period,
(2) changes in revenues of businesses in the travel and tourism industry during the
pandemic period,
(3) changes in employment and sales in industries related to the travel and tourism
industry, and changes in contributions of the travel and tourism industry to such
industries, during the pandemic period,
(4) effects attributable to the changes described in paragraphs (1) through (3) in the travel
and tourism industry and such related industries on the overall economy of the United
States, including (A) an analysis of regional economies (on a per capita basis) during the
pandemic period; and (B) the projected effects of such changes on the regional and
overall economy of the United States following the pandemic period,
(5) the effects attributable to the changes described in paragraphs (1) through (3) in the
travel and tourism industry and such related industries on minority communities,
including Native Americans, Native Hawaiians, and Alaska Natives,
(6) reports on the economic impact of COVID-19 issued by other federal agencies,
(7) costs and health benefits associated with COVID-19 requirements for air travel for
entry into or exit from the United States and any consequent disincentives for tourism,
(8) any federal barriers related to the response to COVID-19 pandemic that are
disincentivizing international tourism to the United States, including source and policy
rationale for these barriers, and
(9) any additional matters the Secretary considers appropriate.
In preparing this interim study, NTTO has reviewed relevant data available and has included as
much responsive information as possible. However, NTTO did not have access to nor is aware
of the availability of information relating to the following matters:

23
• An analysis of regional economies (on a per capita basis) during the pandemic period;
and the projected effects of changes in employment rates, revenues, and contributions on
the regional and overall economy of the U.S. following the pandemic period.
• The effects of changes in employment rates, revenues, and contributions on minority
communities, including Native Americans, Native Hawaiians, and Alaska Natives.
• Reports on the economic impact of COVID-19 issued by other federal agencies.
• Costs and health benefits associated with COVID-19 requirements for air travel for entry
into or exit from the United States and any consequent disincentives for tourism, and
• Any federal barriers related to the response to COVID-19 pandemic that are
disincentivizing international tourism in the United States, including source and policy
rationale for these barriers.
In preparation for this interim study, NTTO consulted with relevant stakeholders in the travel
and tourism industry, including TTAB, to seek their input on how their sectors were impacted by
the pandemic. Some of the most relevant information we received in writing and during the
March 20, 2023 TTAB meeting is included in quotes throughout this report.
As NTTO prepares for the subsequent study due at the end of this year, we will strive to identity
and gather all available research statistics, data, and studies that may be responsive to the factors
outlined by Congress, but which were unavailable at the time of this interim study.
We will incorporate in the subsequent study all relevant information we may obtain from any
source available to NTTO, and will continue to consult with federal agencies, relevant
stakeholders, TTAB, and the public as we prepare the subsequent study.

24
VII. Conclusion
The decade leading up to the COVID-19 pandemic was a robust period of growth for the travel
and tourism industry in the United States. From 2009 to 2019:
• The number of domestic person trips increased by 26% to 2.4 billion.
• The number of international inbound visitors rose 44% to 79 million.
• Real travel and tourism output in the United States increased 48% -- twice as fast at the
24% increase in real GDP.
• Employment supported by domestic and international inbound travel rose from 7.7
million in 2009 to nearly 10 million in 2019. This 28% increase was double the 14%
rise in employment in the rest of the economy.
• As a result, travel’s share of both U.S. GDP and employment increased (see Figure 10).
The COVID-19 pandemic devastated the travel industry in 2020. However, with the introduction
of the COVID-19 vaccines and the opening of the borders to international visitation, travel began
to recover. In 2021, the rise in travel’s share of GDP as well as employment offset more than 40
percent of the declines in 2020. By 2022, the rise in international inbound travel offset more than
half (53%) of the decline that took place in 2020.
The industry is eager to welcome travel and tourism again to the level it once enjoyed.
Government actions have been important in encouraging the recovery experienced to date and
will be important in supporting the industry going forward. The National Travel and Tourism
Strategy provides a blueprint for this recovery effort.
